Table of Contents
CREATING A NEW PROJECT
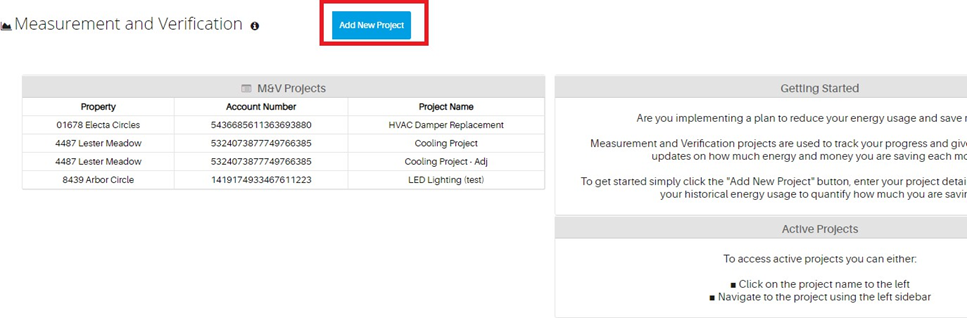
Click on the “Measurement & Verification tab on the left hand side of the dashboard and click.
Add New Project at the top.
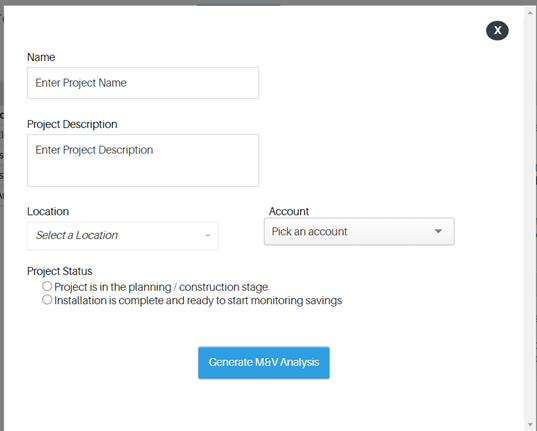
Enter in the project name and a description, then select the property on which the project is taking place. Finally select a project status:
Select “Project is in the planning / construction stage” if the project is not yet complete (please note: there will be no analysis available until the project is completed).
Select “Installation is complete and ready to start monitoring savings” if the project is already finished.
VIEWING CREATED PROJECTS
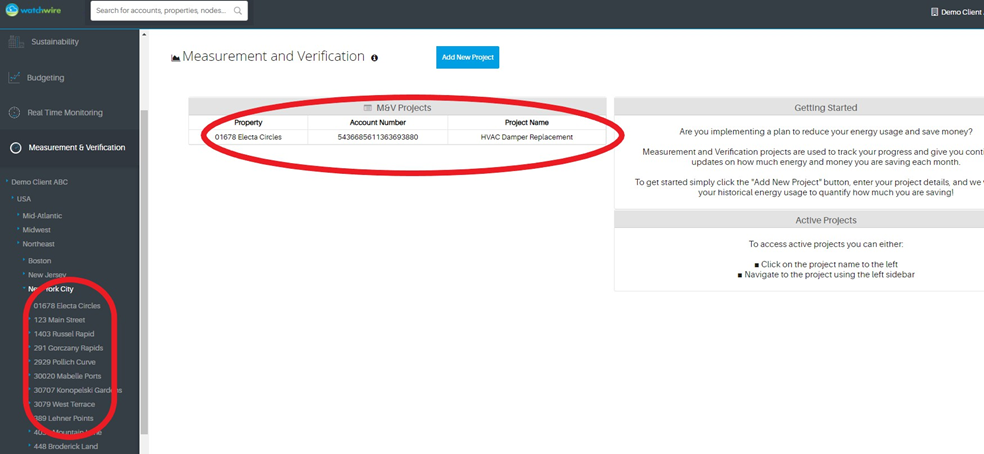
In order to view a project that has already been created, you have 2 options:
Either Click on the existing project in the Measurement and Verification home page or navigate the hierarchy on the left navigation bar to find the property where the project took place.
PROJECT SUMMARY
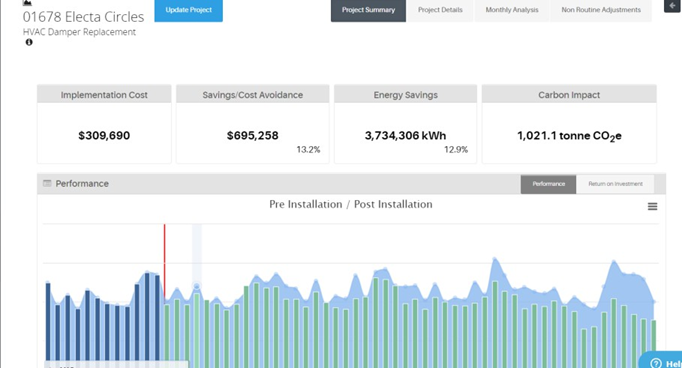
The first tab on the actual project’s page is the Project Summary tab. The information you will find here includes the total cost of the project, the cost savings that resulted from the project, the energy savings, and the CO2e offset. Another piece you will find on the summary tab is a chart that maps out the project’s performance and the return on investment.
PERFORMANCE
The performance chart, as shown above, gives you a good visual on the difference between projected usage if the project had not been implemented and the actual usage post installation. The red line in the above chart marks when the project was installed, anything to the left was pre installation and anything to the right of the line marks post installation. In the post installation piece of the chart, the green bars mark the actual usage and the blue point above it marks what the projected usage would have been.
RETURN ON INVESTMENT
The second chart on the Project Summary tab shows your cumulative total return on investment as a result of the project.
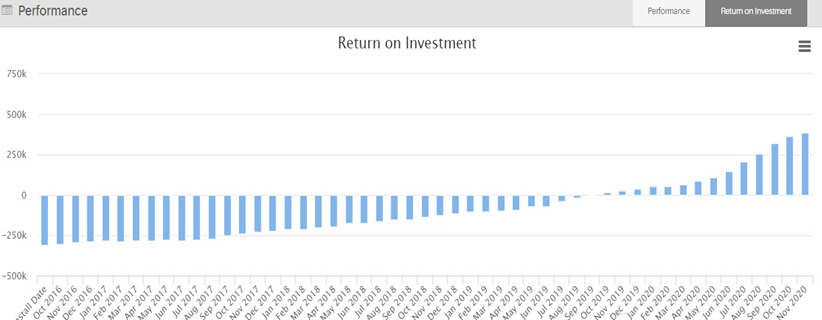
As you can see, the ROI initially is negative given the cost to implement the project, but as time goes on, your cumulative savings increases, and with that, so does your total ROI.
PROJECT DETAILS
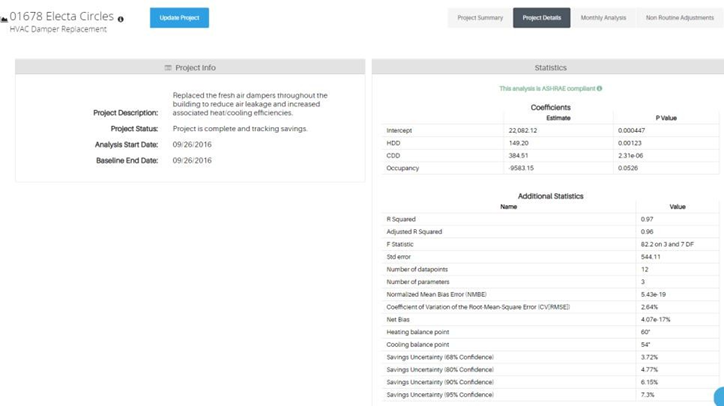
The second tab in the M&V dashboard is the Project Details tab. This is where you can view things such as information of the project or statistics regarding the analysis of the project
PROJECT INFO
The first part of the details tab outlines the information of the project. This includes things such as a description of the project, its status, the analysis start date, and the baseline end date.
STATISTICS
The next section of the details tab shows a chart of significant statistical measures. The top of the statistics section is coefficients explaining the effect of the independent variable of your project on your dependent variables (HDD, CDD, Occupancy, etc.). The bottom section are additional statistics that show how statistically significant the top model is.
ASHRAE GUIDELINES
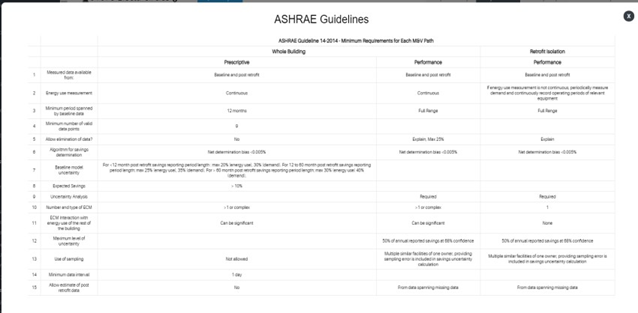
If you would like to view the ASRAE guidelines, click on the green ? icon next to where it says if the analysis is ASHRAE compliant or not (as seen in the screenshot above). If the project is ASHRAE Guideline 14 compliant, the platform will note it as such in green.
MONTHLY ANALYSIS
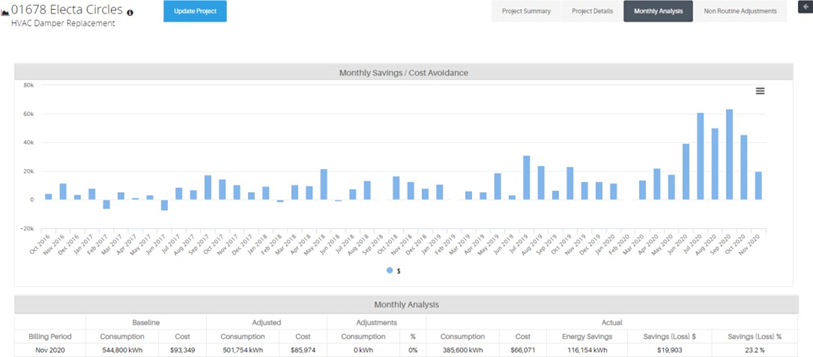
The third tab in the dashboard is the Monthly Analysis section. Unlike the ROI chart that we talked about earlier that shows your cumulative savings as a result of the project over time, the monthly analysis chart shows your savings on a month-to-month basis. You can click on any of the months in the graph and it will produce the chart below that breaks down all your consumption and costs/savings (baseline, adjusted, and actual).
NON-ROUTINE ADJUSTMENTS
The final tab of the M&V dashboard is where you will insert any non-routine adjustments (NRAs). This goes for any adjustments to your baseline period (pre-project start) or your reporting period (post-project completion).
BASELINE ADJUSTMENTS
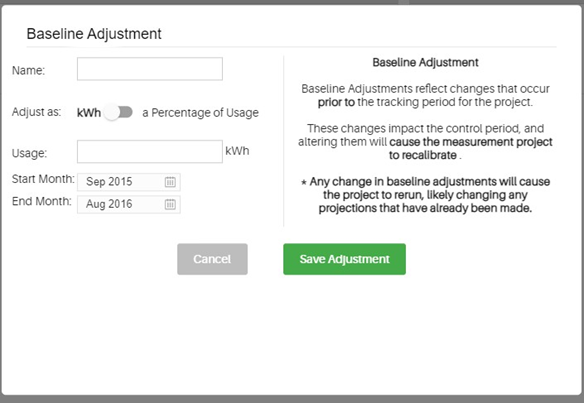
In this section you will make any adjustments necessary to your baseline should an event occur that would throw your baseline off. For example, if you were implementing a project during the fall of 2020, your baseline would most likely be thrown off due to the COVID-19 pandemic, so you would create this NRA to make the analysis more accurate.
REPORTING PERIOD ADJUSTMENTS
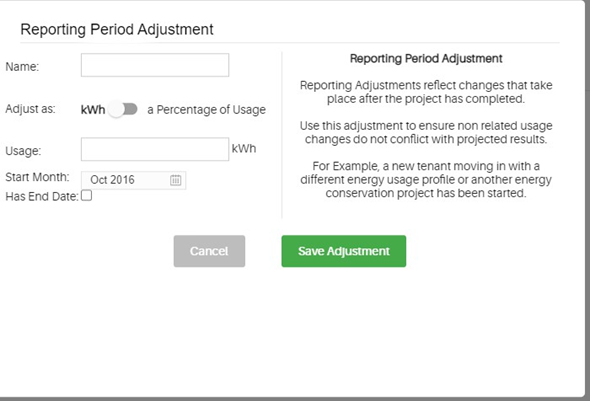
Like the Baseline Period Adjustments section, you will make any changes that might affect your reporting period here. An example where this may be necessary would be a new tenant, with a vastly different energy profile, moving in and replacing an old tenant.
M&V PERFORMANCE REPORT
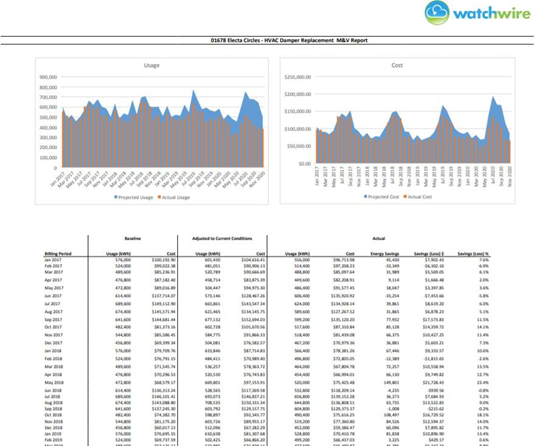
If you would like to run a report that you can export to excel or in PDF form, you can click on the reporting dashboard on the left-hand side of the screen. You then will choose the “M&V Performance” report, pick a project to run it for, along with the time period, then click “Run”.
Similar to the “Monthly Analysis” tab, this report provides a month-by-month breakdown of your baseline, adjusted baseline and actual consumption and cost/savings. Unlike the latter you can view months in bulk with this report as well as separate usage and cost charts. You can aggregate multiple projects for this report as well.
M&V WIDGET
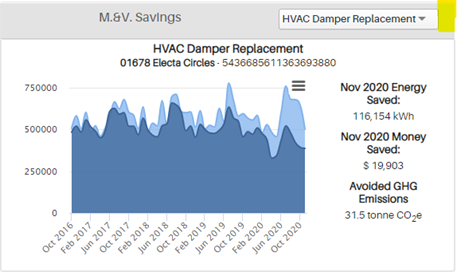
On WatchWire’s Home tab, you can view summary widgets of your data in the system. If you would like one of those widgets to be an M&V widget, then all you need to do is hover over the top right-hand corner of the existing widget and a pencil will appear. Then choose the “M&V Widget” in the drop down. Select what project you would like to view and the above chart will appear with a graph of actual (dark blue) vs projected usage (light blue). Also, there will be a snapshot of your savings, both consumption and monetary, for the current month.
Was this article helpful?
That’s Great!
Thank you for your feedback
Sorry! We couldn't be helpful
Thank you for your feedback
Feedback sent
We appreciate your effort and will try to fix the article