Table of Contents
- DASHBOARDS
- INVOICE MANAGEMENT
- REPORTING
- SUSTAINABILITY
- BUDGETING
- REALTIME/INTERVAL MONITORING
- MEASUREMENT & VERIFICATION
- PEAK LOAD MANAGEMENT
- ACCOUNTS PAYABLE AUTOMATION
- TANGO E&S AUTOMATED UTILITY BILL CAPTURE
- AUTOMATED HISTORICAL DATA
- TANGO E&S AUTOMATED INTERVAL DATA CAPTURE FROM UTILITY
- TANGO E&S HISTORICAL INTERVAL DATA CAPTURE FROM UTILITY
- TANGO E&S UTILITY INVOICE OPTICAL CHARACTER (OCR) RECOGNITION OF PDF BILLS
MAJOR FUNCTIONS
Below, you will find a brief overview of the major functions and modules within Tango Energy & Sustainability (E&S). For a more detailed instruction of each module, proceed to the next chapters.
From Invoice Management to Sustainability, Tango E&S provides all the use cases needed to fit your organization’s many needs.
DASHBOARDS
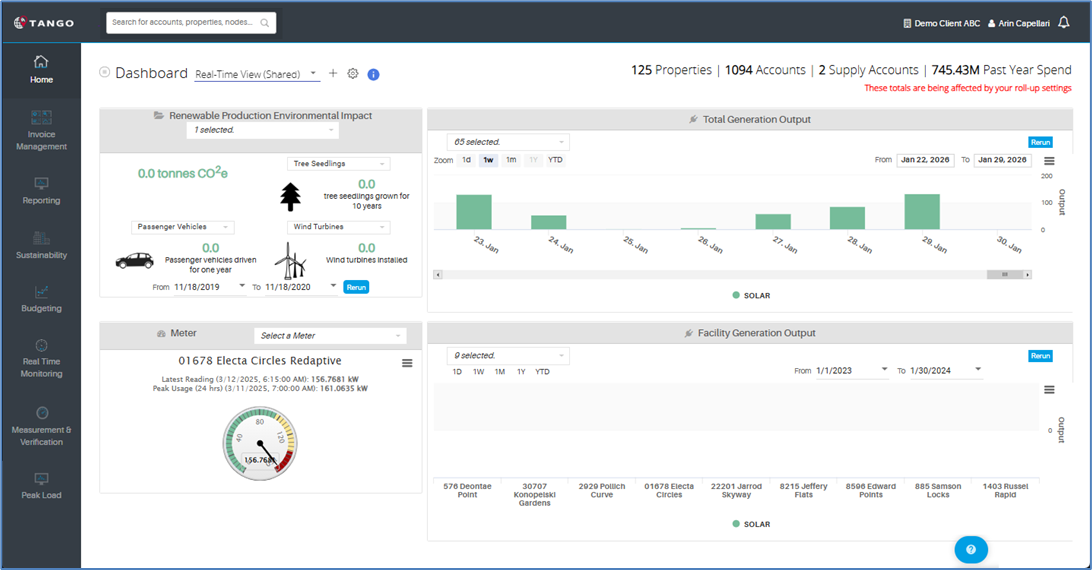
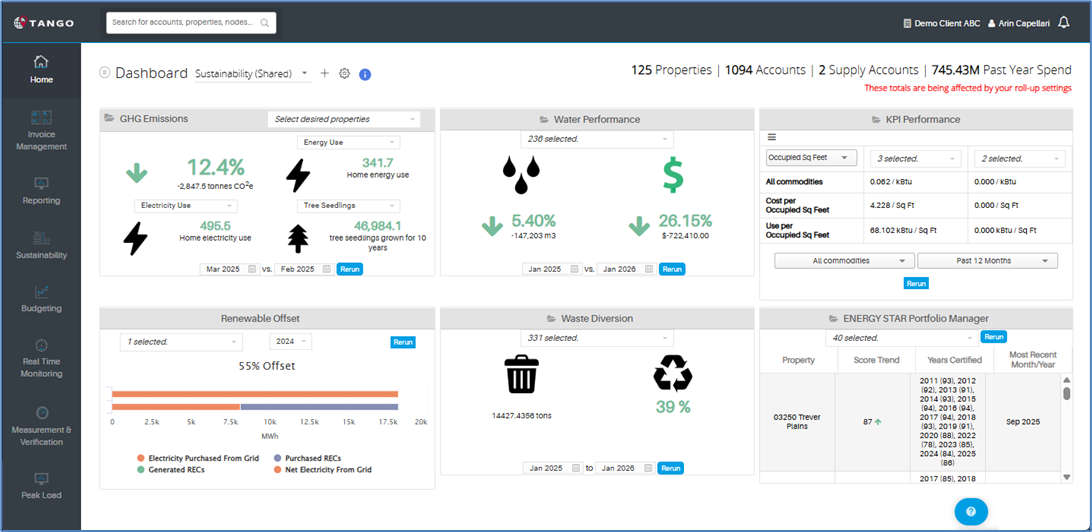
Tango E&S features robust, easy to use, and graphical dashboards customizable by the user. Whether it is for your sustainability team or your finance team, Tango E&S’s dashboards customize to the user’s needs with sticky preferences ensuring changes are saved automatically, so the next time you log in your dashboard preferences are loaded. The setup of the dashboards is intuitive, so any user can create and update their own views easily.
Additionally, Tango E&S allows admins to assign dashboard views for different users, regions, or properties.
Tango E&S’s dashboards offer a wide range of widget options to make sure that your team’s needs are met across every job function to include Engineering, Accounting, Sustainability, Procurement, Operations, Energy Manager views, and more. The dashboards can be filtered by region, city, building(s), etc., so users can view only what is important to their role. The dashboards easily aggregate and analyze your commodity data across your entire portfolio.
Hierarchical navigation is another key feature you will find in Tango E&S’s dashboards. Whether you have a handful of properties under your management or thousands, the organized hierarchy ensures that the information you need is easily accessible when you need it. The hierarchical navigation pane is user defined and allows as many layers as you need to best represent the logical organization of all your properties and assets. The system also allows custom grouping of properties based on type (i.e., office vs. datacenter), location, or building characteristics (i.e., occupancy level or ENERGY STAR score).
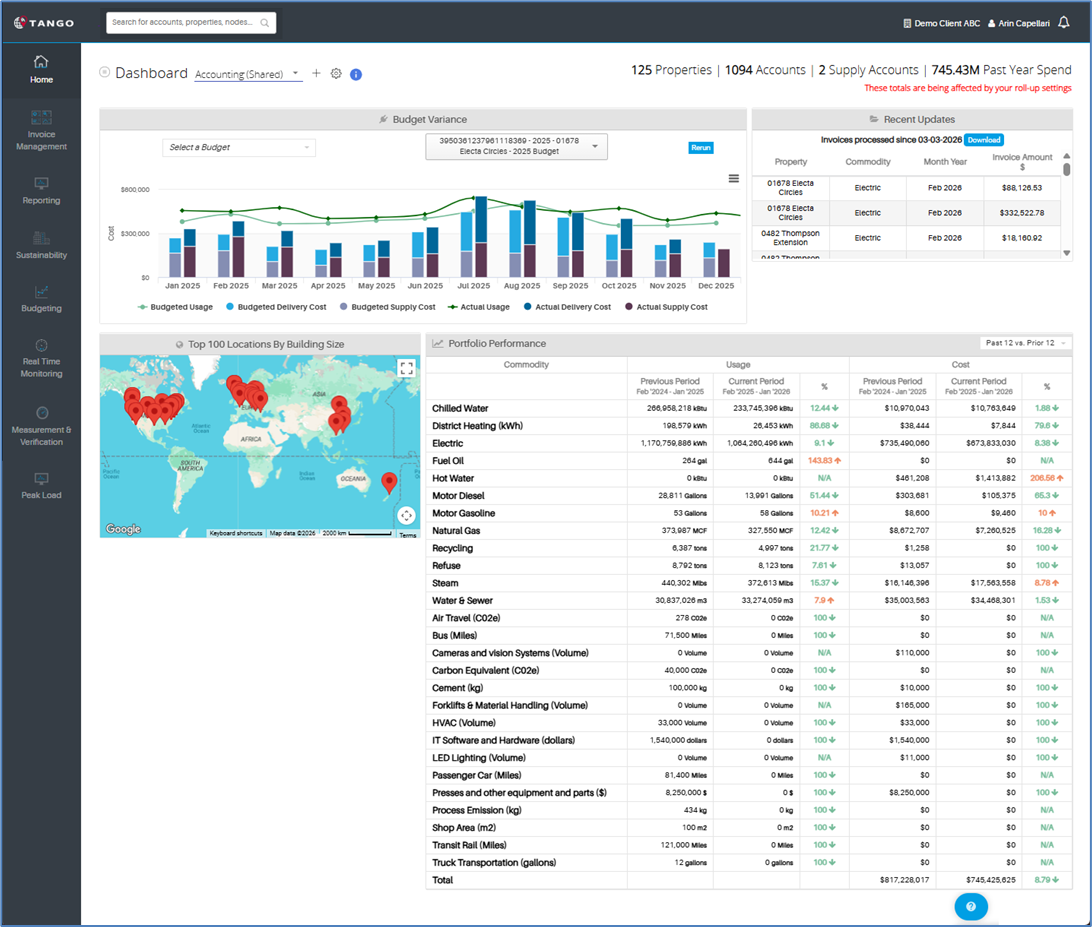
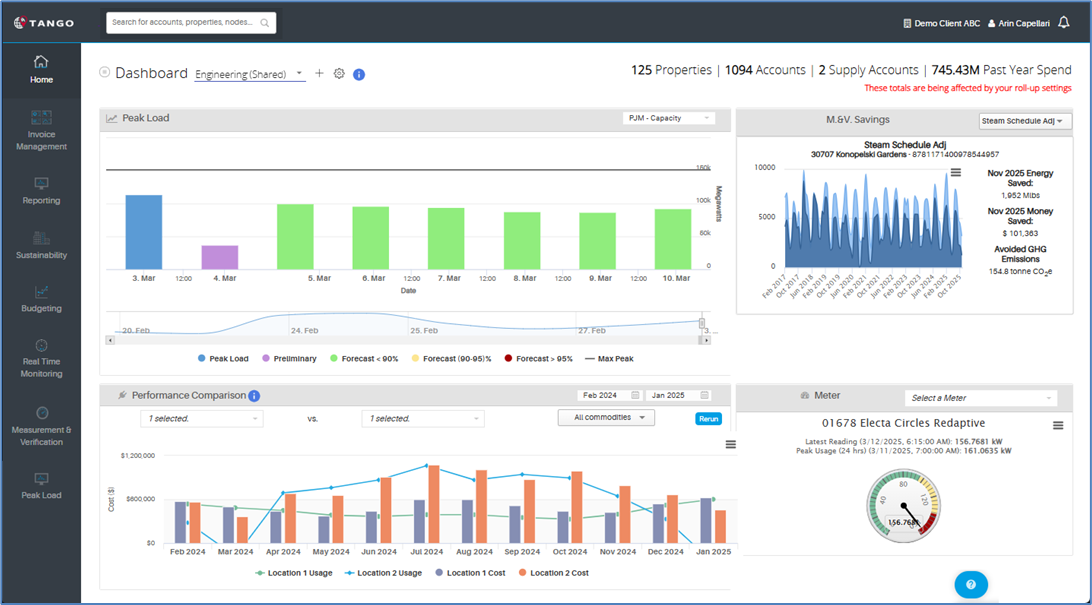
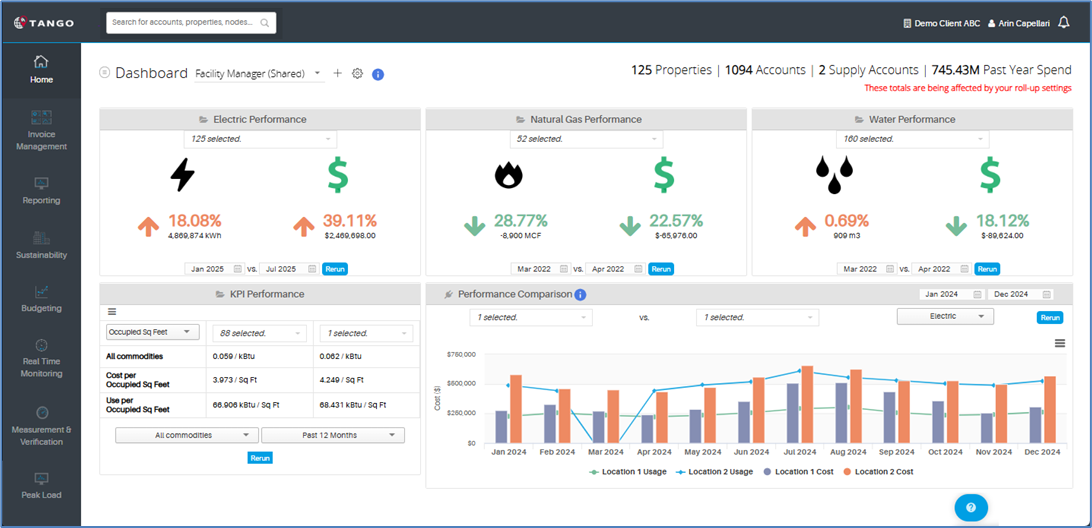
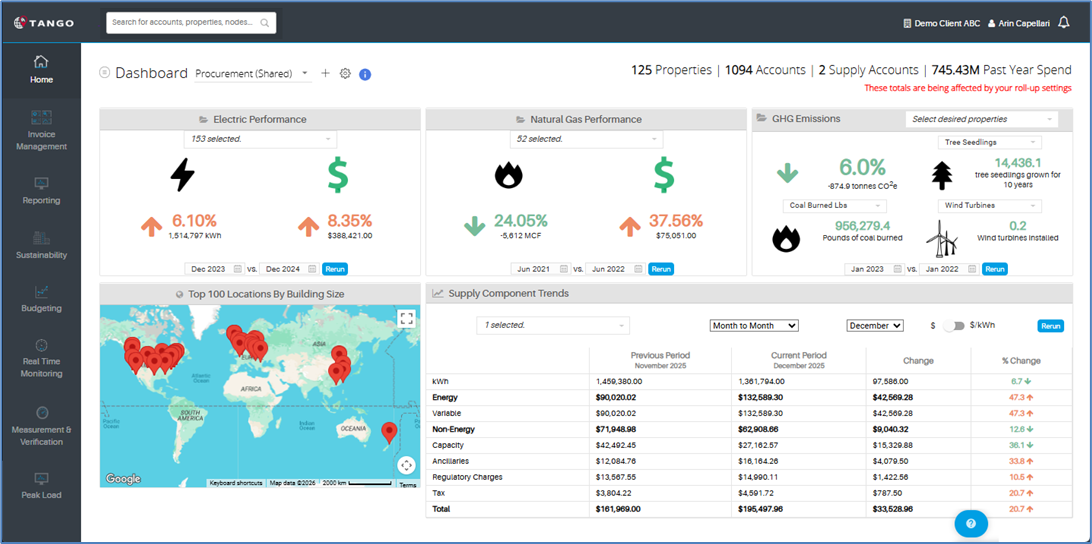
Default Dashboard examples are displayed below:
ACCOUNTING
ENGINEERING
FACILITY MANAGER
PROCUREMENT
REAL-TIME VIEW
SUSTAINABILITY
INVOICE MANAGEMENT
Tango E&S’s Invoice Management module features building/facility invoice data by region or portfolio, multiple currency tracking, and unit conversions. Tango E&S can automatically acquire invoices from utilities, so you do not have to spend time manually extracting and tracking data. Tango E&S captures every line item from an invoice and categorizes those line items into their respective component buckets: Consumption, demand, flat charges (e.g., customer service charge, meter charge, etc.), taxes, and miscellaneous (e.g., late fee, deposit, etc.). Reports can be generated specific to certain line items (e.g., demand charges, capacity), while our measurement and verification module uses the component breakdown to accurately calculate true marginal cost savings due to efficiency projects (rather than simple average unit cost. Where online billing is not available, we require the utility/client to email invoices to a centralized invoice mailbox to be processed.
In our Enterprise level service, our analysts and account managers handle billing error resolution with the utilities and ESCOs. You can receive summary processing reports, showing how many invoices were processed in each time frame, the number of failed audits, the number of calls made to utilities/ESCOs to resolve issues, and notes regarding outcomes.
The entire lifecycle of an invoice is tracked within Tango E&S. Designated users can be automatically notified of any billing errors and/or missing/late bills. These reports can also be generated at any time on demand from the reporting section. All invoice images are captured and accessible via the platform and invoice images can be downloaded individually or in bulk from our reporting section.
REPORTING
With Tango E&S, reports containing invoice data, budget variances, measurement and verification, and more can be generated at any time by any user. Reports can be generated at the account, property, region, and/or portfolio level to analyze granular data as well as roll-up summary information. Through intuitive filters, you can choose which commodity(ies) to include in the reports allowing for reporting in native units as well as a summary roll up on a universal unit basis (e.g., kBtu). Time periods are flexible, meaning you control which range of months/years to include in reports. With over thirty standard reports in the platform, you can analyze consumption, demand, cost trends, weather impact, budget performance, facility comparisons, KPI reports, and more. Reports natively integrate with Microsoft Excel, so exports from our platform maintain all formatting (i.e., no hidden rows/columns, data formatting remains so it is easy to edit, copy/paste, etc.). Reports can also be exported to .csv and .pdf.
Additionally, users can be added to monthly distribution lists to automatically receive (via email) system generated reports chosen by you. For example, property managers in one location can receive the Cost and Consumption Trend Report, while property managers in a different location receive the Utility Variance and Trend Analysis Report. Reports are generated as soon as invoice data is acquired, audited, and approved.
SUSTAINABILITY
Tango E&S’s Sustainability Module helps streamline, automate, and standardize your sustainability reporting process. The platform stores and analyzes all energy, water, waste, and emissions data, providing a single source of truth for your organization. With multiple integrations to LEED Arc, GRESB, and more, standardizing your sustainability reporting process is made easy.
Tango E&S analyzes your building(s) against each other, or against similar subsets of buildings to show whether you are a low- or high performing building, identify and prioritize cost-saving and emissions-reducing energy efficiency improvements, and assess the range of likely savings from these improvements. Through Tango E&S’s integration with the US Department of
Energy’s Building Performance Database (BPD), properties can be benchmarked against the
nation’s largest dataset of energy-related characteristics of commercial properties. You can analyze property data against any defined subset of commercial properties to identify how you compare to the median electricity use for this subset, and where your property ranks relative to its peers.
Additionally, Tango E&S integrates with Energy Star Portfolio Manager’s API, so you can automatically benchmark your data to comply with local laws. Whether or not your city/state requires ENERGY STAR benchmarking with your data, your property/portfolio can still benefit from voluntarily reporting to Portfolio Manager. If your organization is utilizing our Managed Service model, we can submit completed reports on your behalf.
Tango is also a GRESB Premier Data Provider, helping real estate portfolios accurately and quickly report their energy performance indicators. Tango E&S integrates directly with GRESB’s reporting site, allowing automatic update of performance data each year without having to spend time and resources collecting the data, manually updating the data, or uploading spreadsheets to the reporting site.
BUDGETING
Tango E&S’s Budgeting Module allows you to obtain data-driven, defensible, and accurate forecasts of your energy costs and consumption. You can generate specific budgets for electric, steam, natural gas, and water based off of historical invoice data and various independent variables that may affect usage/demand for these commodities, e.g., weather variables (wet bulb temp, heating and cooling degree days, humidity, cloud cover, etc.), occupancy (square feet occupied, percentage, hourly full-time equivalents, rooms occupied, etc.), or any other KPI variable that can be fed to our system to analyze.
The Budgeting Module analyzes historical data against a variety of variables to create multiple different forecast models. To incorporate potential adjustments, Tango E&S provides the ability to enter leasing/occupancy projections, energy conservation measures, public service rate case increases/decreases, custom line items for new legislative charges (e.g., clean energy standards), as well as countless free form adjustments to tailor the budget to your business.
Once budgets are completed, you can reforecast with a single click to incorporate to date actual invoice data and reforecast the remaining budget period based on the latest data. Each month, our budget variance reports allow you to track performance vs. the budget, as well as explain any variances due to usage and/or rates. These reports can be scheduled to appear in your email inbox automatically.
Finally, the Budgeting Module has a prepopulated notes section that can be updated to include narrative on how the budgets were calculated and what assumptions and factors were used in calculating the budgets.
REALTIME/INTERVAL MONITORING
Tango E&S’s Real-Time Monitoring Module allows you to fully leverage your real-time energy data by analyzing it alongside your actual utility bills and costs. The dashboard provides an overview of your meter’s interval data in the respective intervals, which can be viewed by current day, week, year, or any selected timeframe, such as “Billing Period.”
Tango E&S offers various visualizations of real time data through heat map analytics and monthly and daily profiles analysis. These types of visualizations make it simple to spot irregularities in equipment operating times or other operational anomalies. You can download the graphs as images or export them to Excel.
MEASUREMENT & VERIFICATION
Tango E&S’s Measurement & Verification Module integrates all meters, weather, occupancy, or any other trackable independent variable to present easily accessible M&V performance to all interested parties. Energy conservation measures and efficiency projects are tracked within Tango E&S and measured and verified according to IPMVP and ASHRAE Guideline 14-2014.
Designed by an AEE accredited Certified Measurement and Verification Professional (CMVP), our M&V module processes both IPMVP Option B and C analysis, depending on the data fed to the module.
Option B utilizes sub-metering and/or equipment level metering for retrofit isolation, while Option C utilizes invoice and/or whole building interval data, combined with cost data from the utility invoice. Data is regressed against weather and occupancy variables and then consumption/demand is projected to report what usage would have been in the absence of the efficiency project. Current period cost savings/avoidance are projected based on the projected usage/demand and the marginal unit cost in the current billing period. The savings (cost and energy avoidance) are the difference between what was projected and the actual metered consumption. Relevant statistics necessary for compliance with ASHRAE Guideline 14-2014, such as model CV(RMSE), are provided by the platform.
PEAK LOAD MANAGEMENT
Ultimately, to manage your peak load contribution effectively and efficiently, you need to know what the utilities will not tell you – when the peak load hours are going to occur. Tango E&S’s Peak Load Management Module assists you with peak load management via predictive analytics that monitor the grid’s consumption and weather in real-time and predict when peak load hours are likely to occur (based on our integrations with load forecasts from each ISO, combined with proprietary analyses). Tango E&S will alert designated end users via day- ahead and day-of emails, giving you enough time to take action to reduce your demand when it is most important. Additionally, you can measure and verify all your peak load capital improvements and operational strategies to ensure your plan is effective through Tango E&S.
ACCOUNTS PAYABLE AUTOMATION
Tango E&S’s audited utility data set can be leveraged to streamline the payment of utility bills by directly integrating with your accounts payable software. Tango Analysts will work with your organization to detail the necessary payment information in Tango E&S (e.g., GL Codes, Cost Centers, etc.). Then via REST API or a flat file upload, Tango E&S will auto-populate all the necessary information to facilitate payment to your utility and ESCO accounts managed in the platform.
Reports can be run to generate payment files or uploads at the user’s discretion or scheduled on a weekly or monthly basis. Many AP systems provide a feedback file that can be integrated back into Tango E&S to validate payment and close the loop. Bill attributes such as reviewer and approval status can be tracked and used to manage the payment workflow and ensure the level of oversight required for large utility payments. With automated data ingestion from the utility website as well as the ability to investigate missing bills via reporting, Tango E&S provides a full suite of utility bill management functions to streamline, enhance, and validate your utility accounts payable processing.
TANGO E&S AUTOMATED UTILITY BILL CAPTURE
The automated utility bill capture service is available for supported utilities. The service supports more than 6,000 utilities globally. The prerequisites are the following: 1. Validate Utilities are Supported 2. Utility Accounts enrolled in ebill where required 3. Provide Tango with Logon Credentials to Utility Accounts.
AUTOMATED HISTORICAL DATA
The automated historical utility bill capture service is available for supported utilities. The service supports more than 6,000 utilities globally. The prerequisites are the following: 1. Validate Utilities are Supported 2. Utility Accounts enrolled in ebill where required 3. Provide Tango with Logon Credentials to Utility Accounts.
TANGO E&S AUTOMATED INTERVAL DATA CAPTURE FROM UTILITY
The automated utility bill capture service is available for supported utilities. The prerequisites are the following: 1. Validate Utilities are Supported. 2. Utility Accounts enrolled with interval data service through the utility. 3. Provide Tango with Logon Credentials to Utility Accounts where interval data is stored.
TANGO E&S HISTORICAL INTERVAL DATA CAPTURE FROM UTILITY
The automated utility bill capture service is available for supported utilities. The prerequisites are the following: 1. Validate Utilities are Supported. 2. Utility Accounts enrolled with interval data service through the utility. 3. Provide Tango with Logon Credentials to Utility Accounts where interval data is stored.
TANGO E&S UTILITY INVOICE OPTICAL CHARACTER (OCR) RECOGNITION OF PDF BILLS
Tango E&S Utility Invoice OCR PDF Capture is available for utility accounts not supported through Tango E&S Automated Bill Capture. Individual High Quality PDF images need to be provided for both current and historical bills. Invoice PDFs should be separated by billing period, not consolidated within a single file. Additional fees may apply for international invoices.
Was this article helpful?
That’s Great!
Thank you for your feedback
Sorry! We couldn't be helpful
Thank you for your feedback
Feedback sent
We appreciate your effort and will try to fix the article