Table of Contents
NAVIGATING THE CONTAINER HIERARCHY
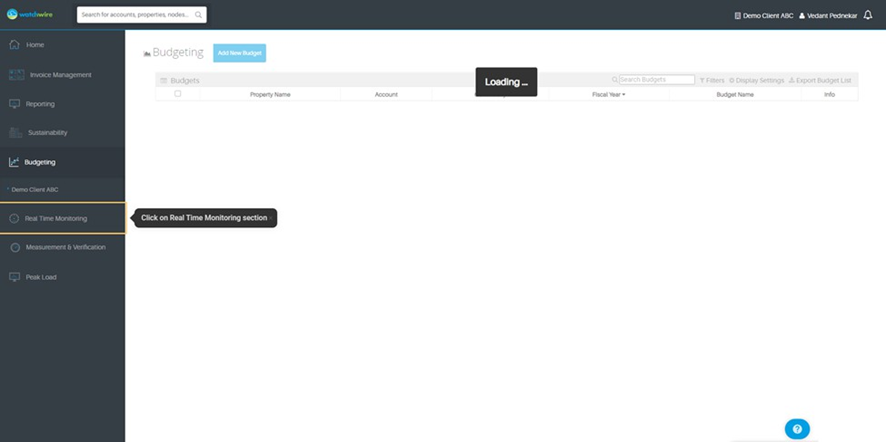
First, navigate to the Real time monitoring module found on the left-hand side’s navigation bar. Each meter in WatchWire is listed with the option of organizing them by a specific internal grouping or hierarchy.
OVERVIEW
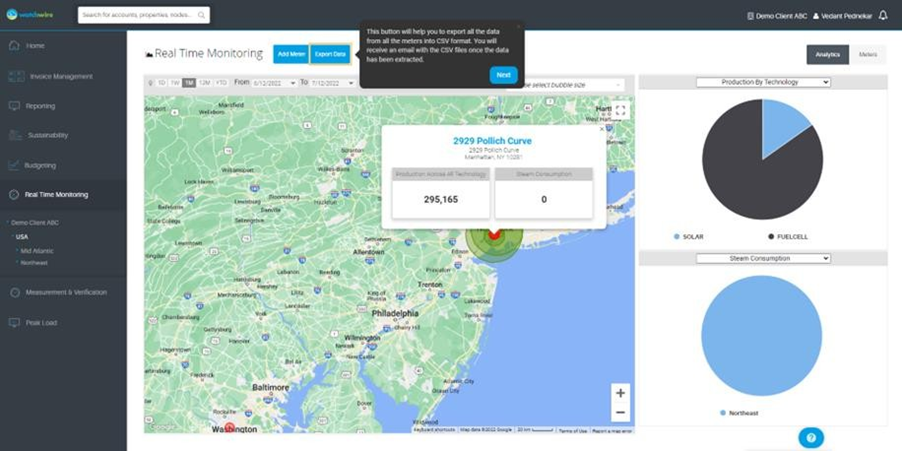
The blue “Export Data” button at the top will allow you to export all data from all meters in one CSV format Excel document. You will receive an email with the CSV files once the data has finished extracting.
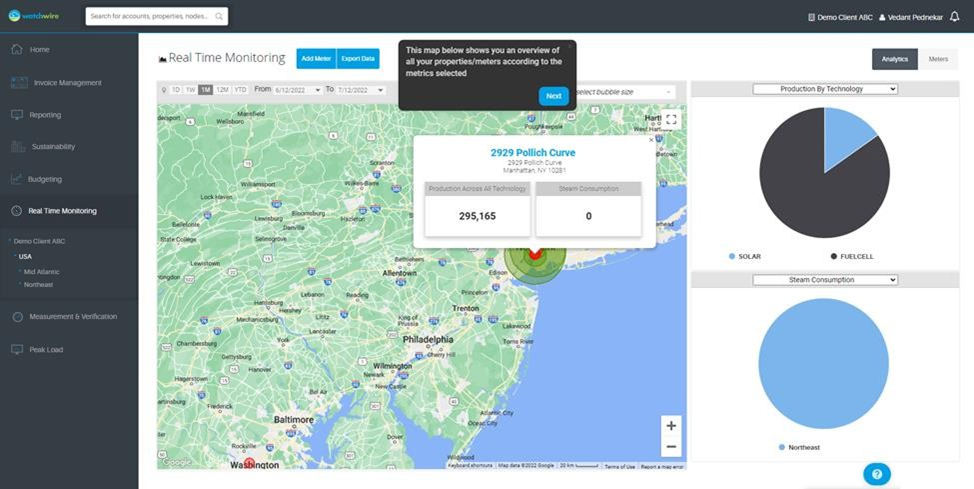
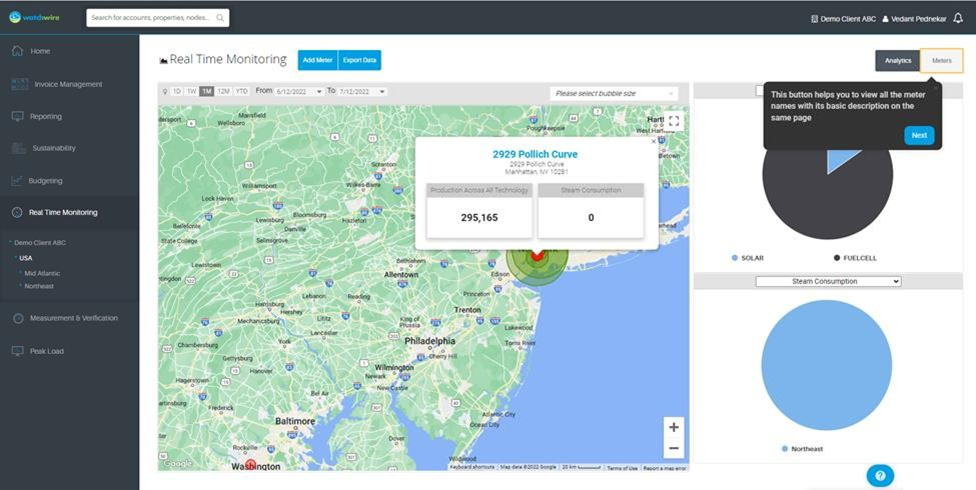
The below map provides an overview of all the properties/meters under your portfolio.
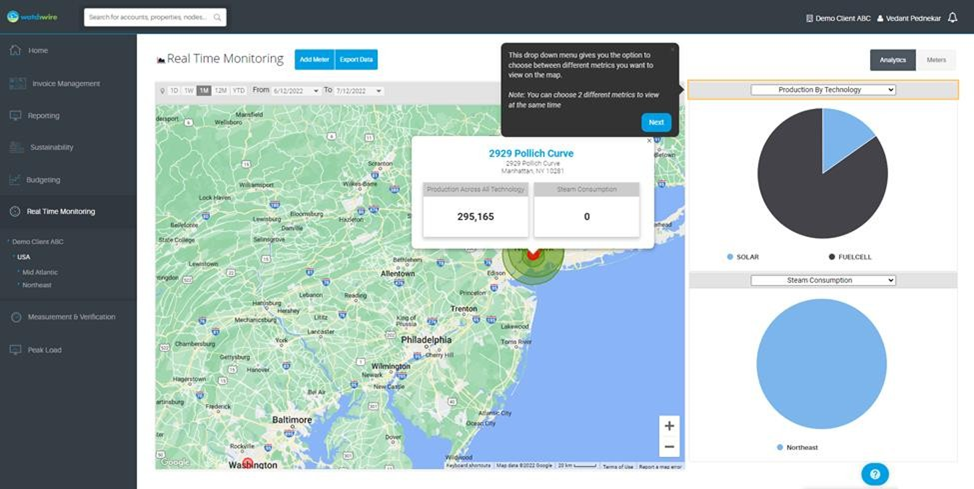
There is a drop down menu on the right that gives you the option to choose between different metrics you want to view on the map. Depending on your account, you can choose between kWh Production, Production by Technology, Electric Consumption, Natural Gas Consumption, Water Consumption, Steam Consumption, Renewable Production Avoided Emissions, and Installed Capacity.
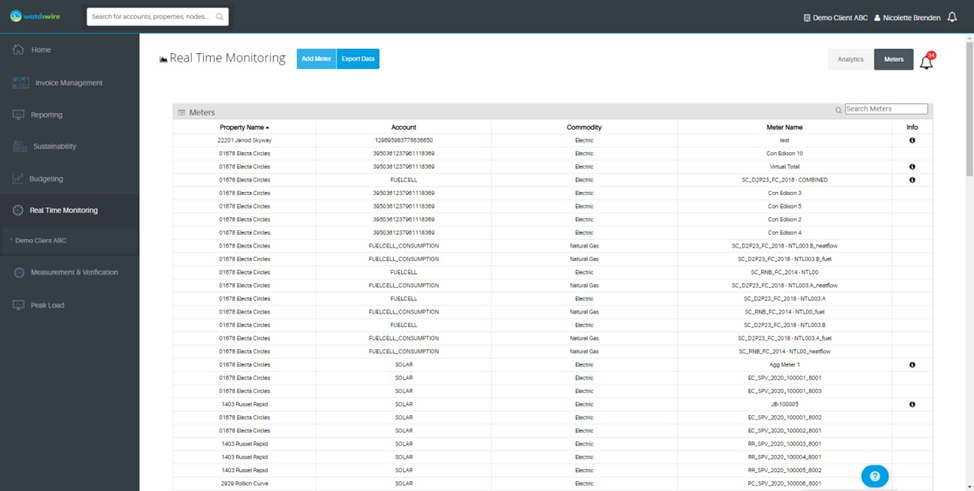
In addition, by clicking on the ‘Meters’ button near the top right corner of the screen, you will see a list view of all your meters.
ADD A NEW METER
Once on the Meter page, click on “Add Meter” near the top of your screen.
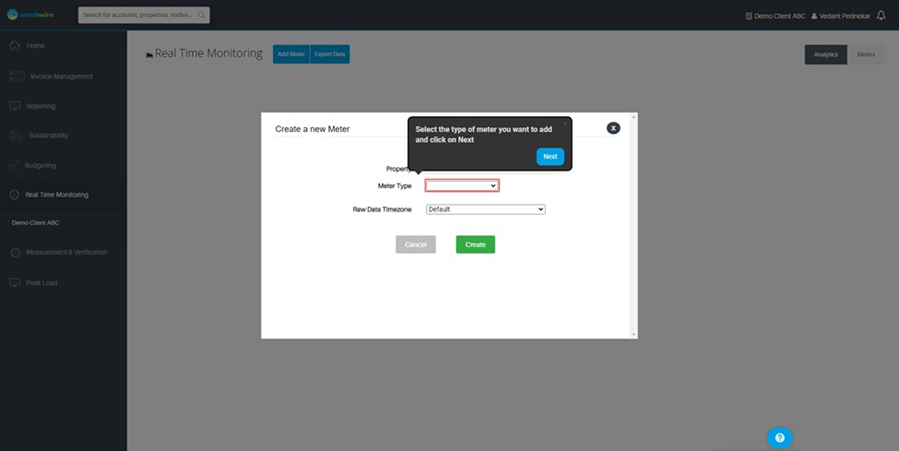
First, select a property from the drop down you would like to add the new meter to. Next, select the type of meter you would like to add.
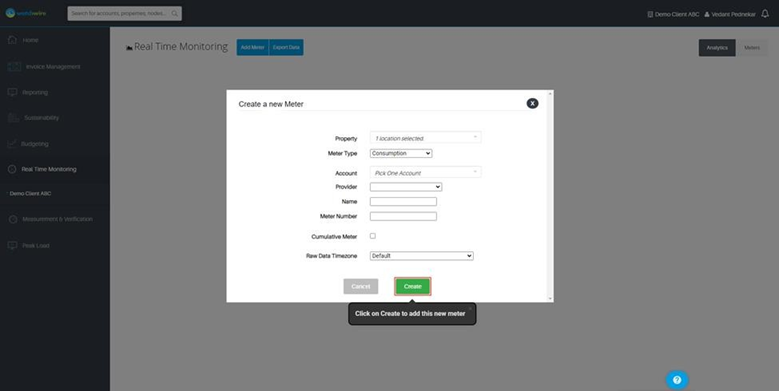
Complete the rest of the meter characteristics. A few things to note:
Cumulative meter: Configuring a meter as cumulative will interpret each meter reading as the total accumulated amount of energy on the meter. Since our system needs the delta between meter readings, the difference between current and last reading will be calculated.
For example: [1000 kWh Meter Reading at 12:15 - 900 kWh Meter Reading at 12:00] = 100 kWh Interval Meter Reading for 12:15 in kWh
Raw data time zone: Raw data time zone will set the time zone of your raw data source. If 'Default' is selected the time zone of the property where the meter is located will be used.
After filling in all the fields, click on Create to add a new meter to your portfolio.
EDIT/UPDATE A METER
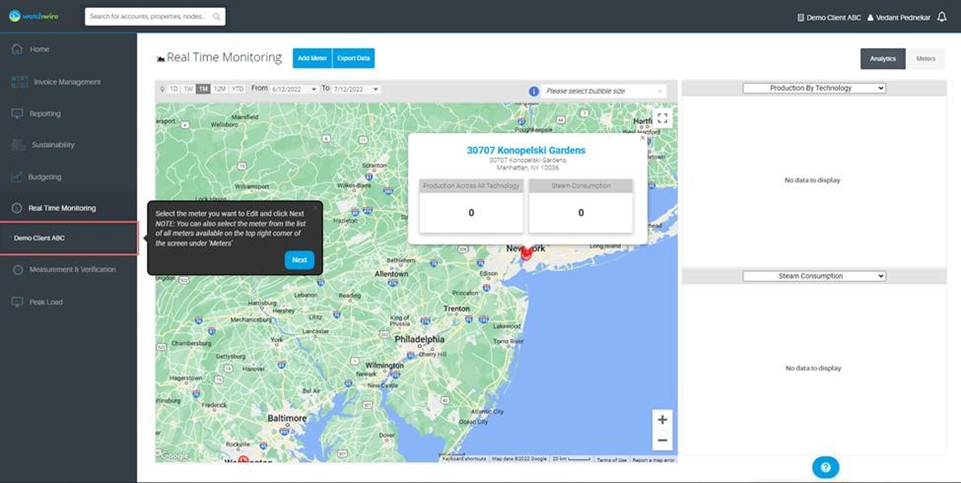
Navigate to the meter from the hierarchy on the left side that you would like to edit.
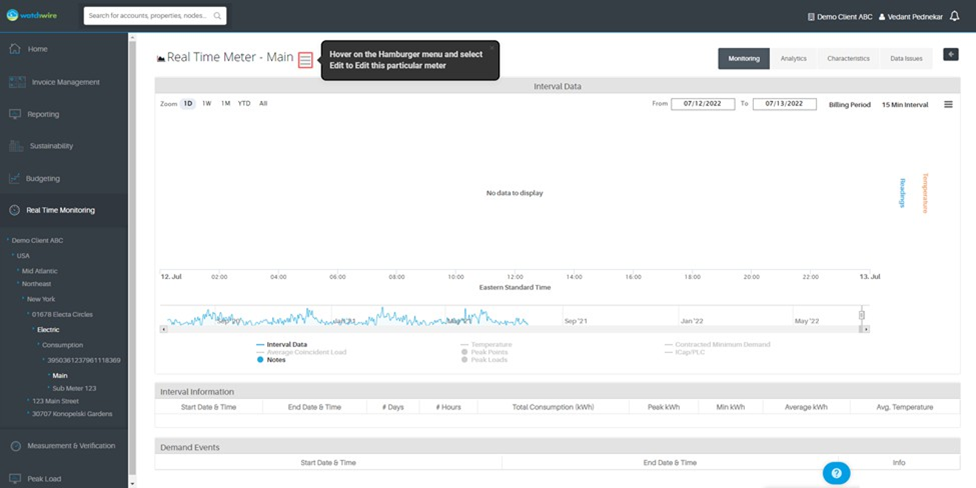
Hover over the hamburger menu that you will see on the top of the page, and select Edit from the list of options.
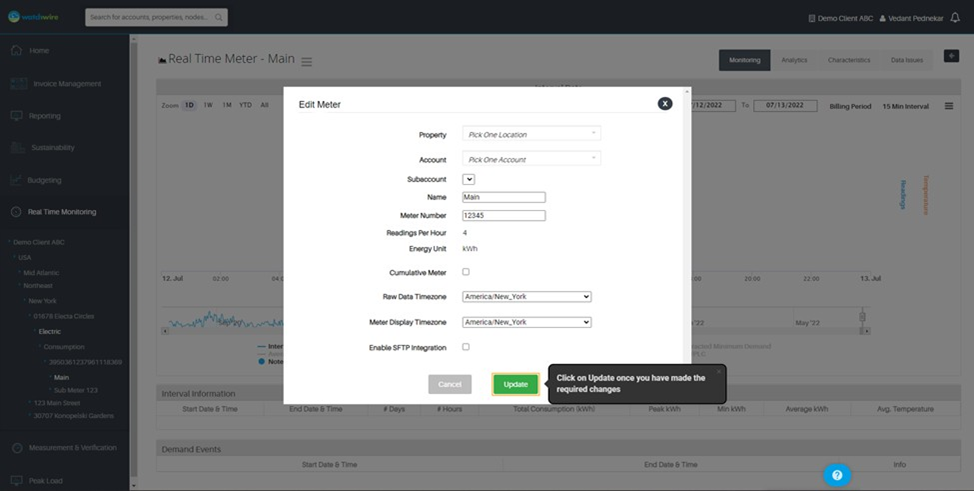
Make the required changes from the options on the screen and click on Update to save the changes.
EXPORTING INTERVAL DATA FOR A METER
Navigate to the meter from the hierarchy on the left side that you would like to export the data for.
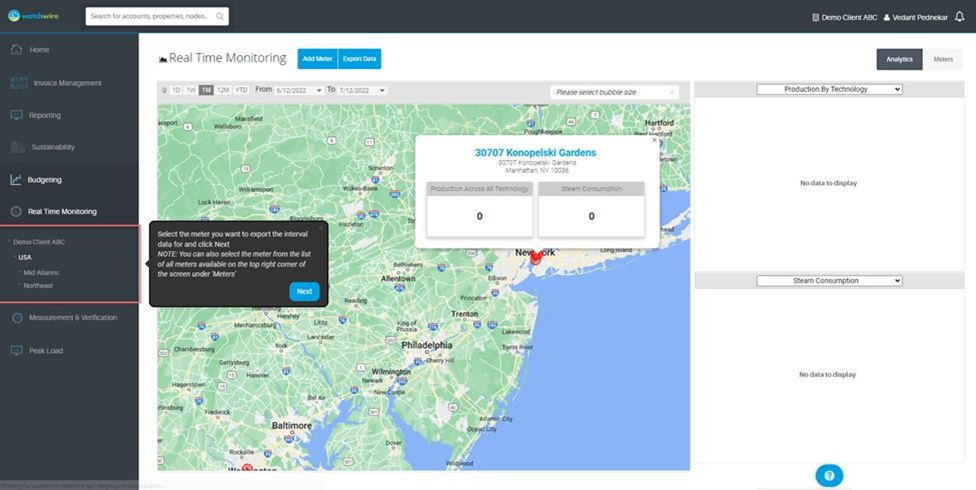
Click on the hamburger menu near the top right corner of the screen, just anova the data graph. Several options for exporting will appear: Download PNG Image, JPEG Image, PDF Document, SVG Vector Image, or CSV file. Select which you would prefer
ADD A NOTE TO THE INTERVAL DATA
Navigate to the meter from the hierarchy on the left side that you would like to add a note to.
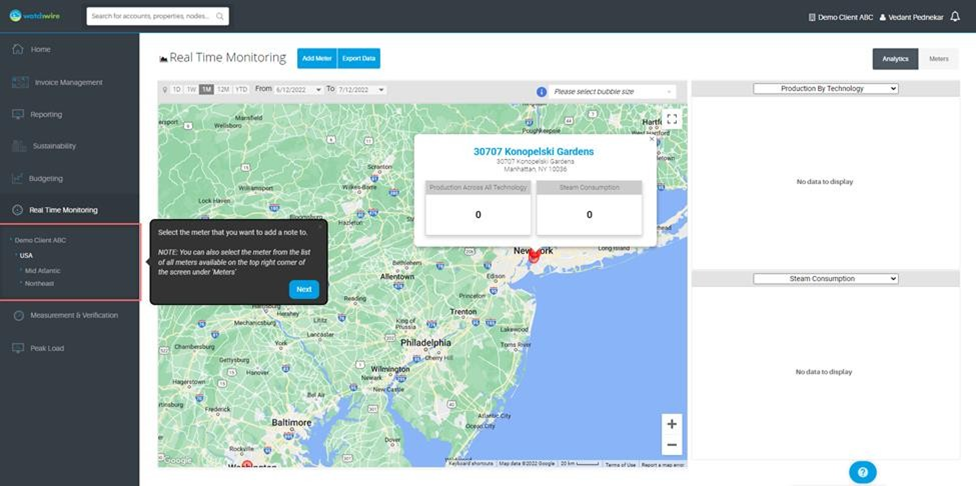
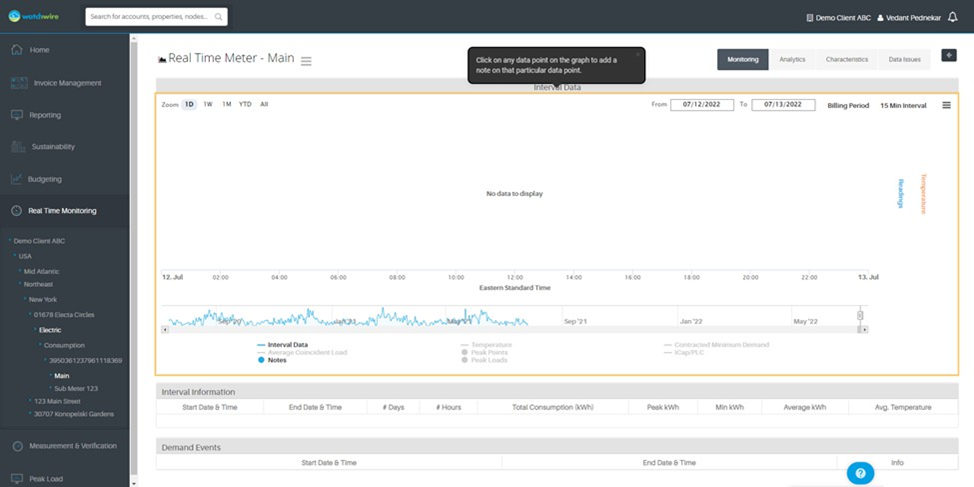
Once you select the meter, click on any data point from the graph you would like to add a note to.
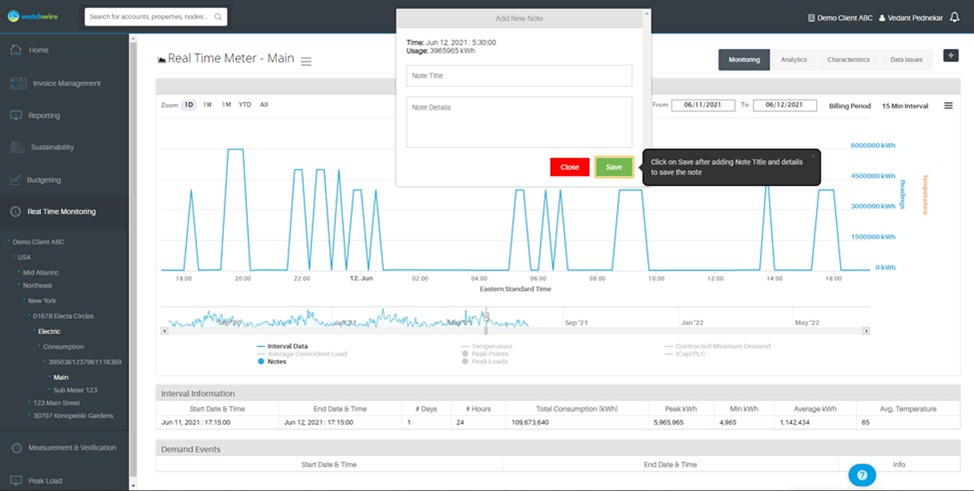
You will see a pop up as shown below. Add your Title and Details and click on Save to save the note to the graph.
IMPORT DATA TO A METER
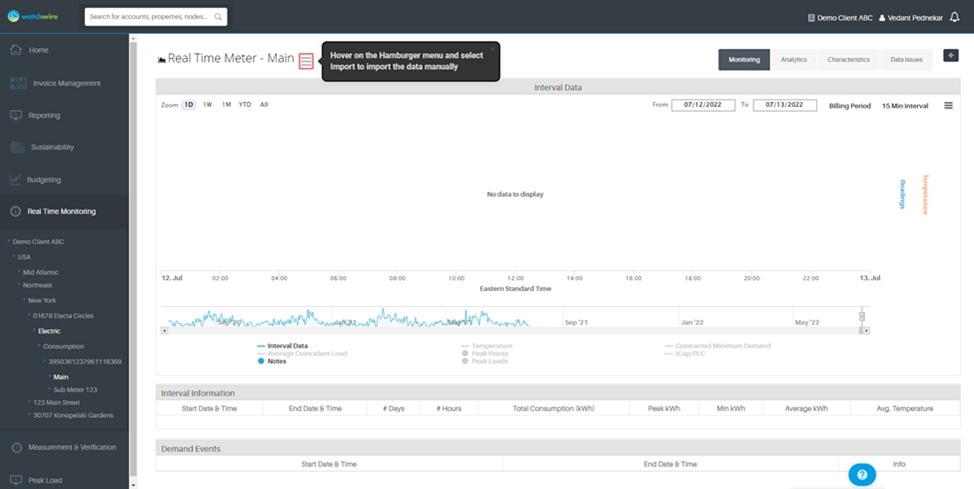
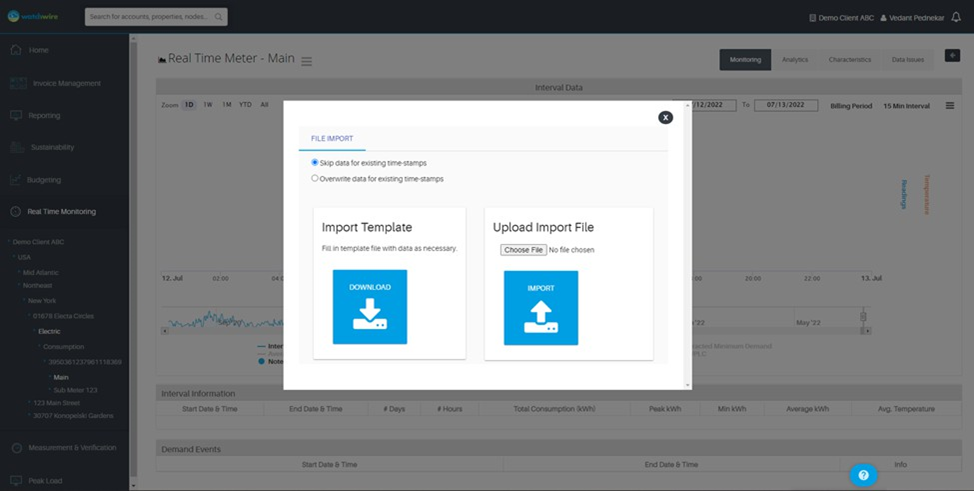
Navigate to the meter from the hierarchy on the left side that you would like to import the data for. Hover over the hamburger menu at the top of the screen and select Import from the drop down to import your data manually.
Select between skipping the existing the timestamps and updating only new entries, or overwriting data for all existing time stamps. Click on Import template to download the import file. Use this file to input your data and then upload this file by clicking on Import.
CUSTOM METER CHARACTERISTICS
Navigate to the meter from the hierarchy on the left side that you would like to add the custom characteristics for.
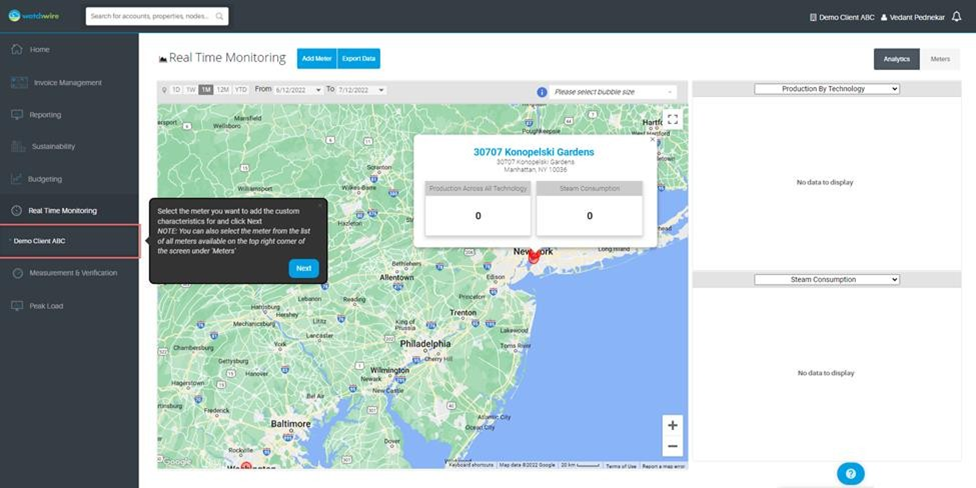
Click on Characteristics on the top left side to proceed.
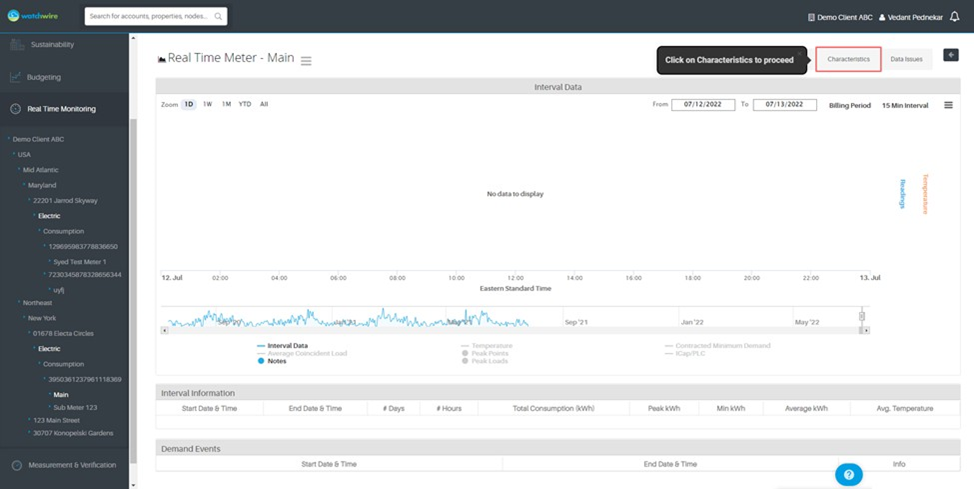
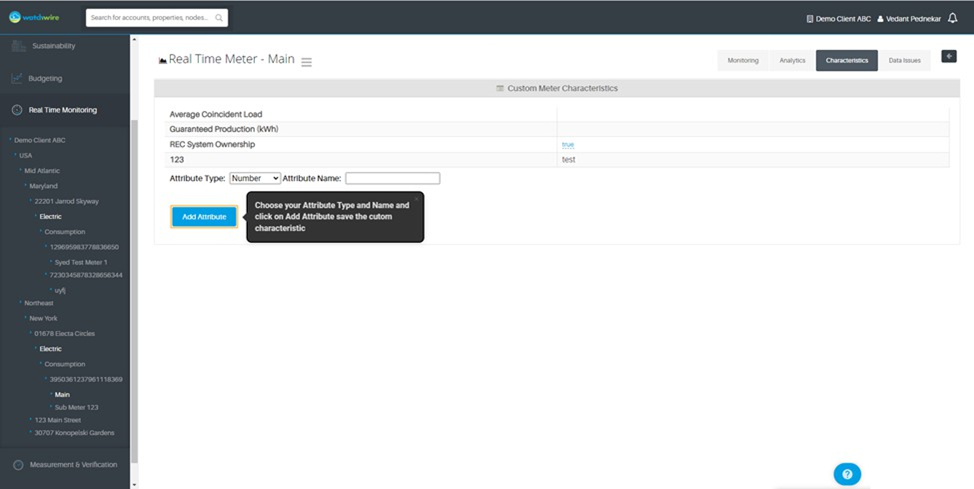
From this page, click on Add to add a custom characteristic to that particular meter.
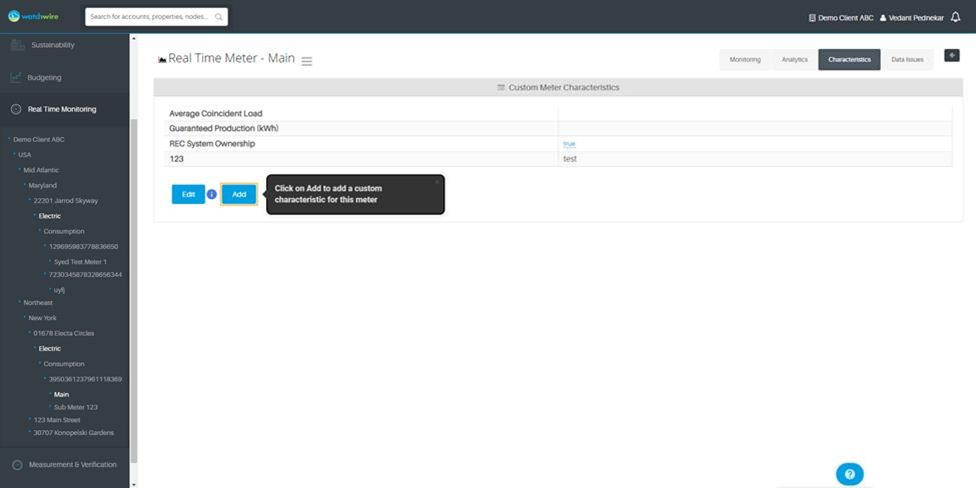
Choose the Attribute type from: Number, Text, True/False, Date, Dropdown, System. Enter your Characteristic name and click on Add Attribute to save.
DATA ISSUES
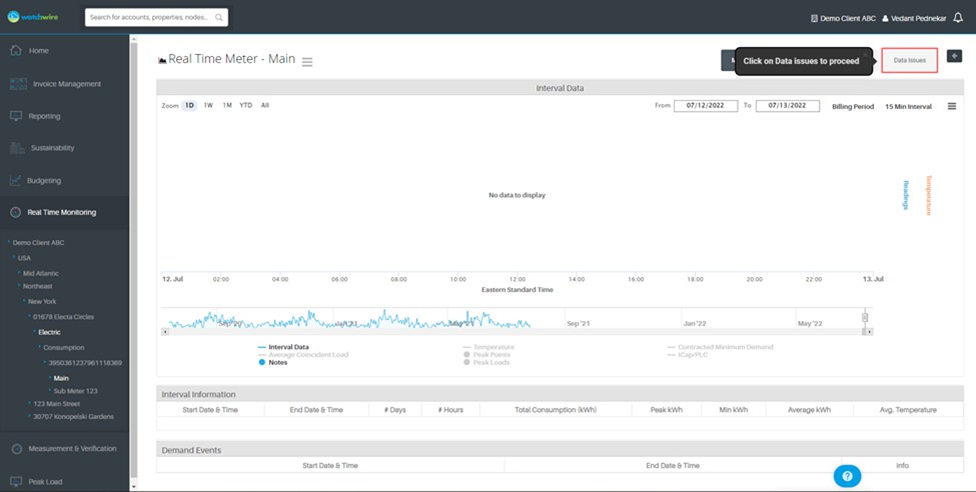
After selecting a meter that you would like to see data issues for from the hierarchy on the left, click on Data Issues near the top right corner of the screen.
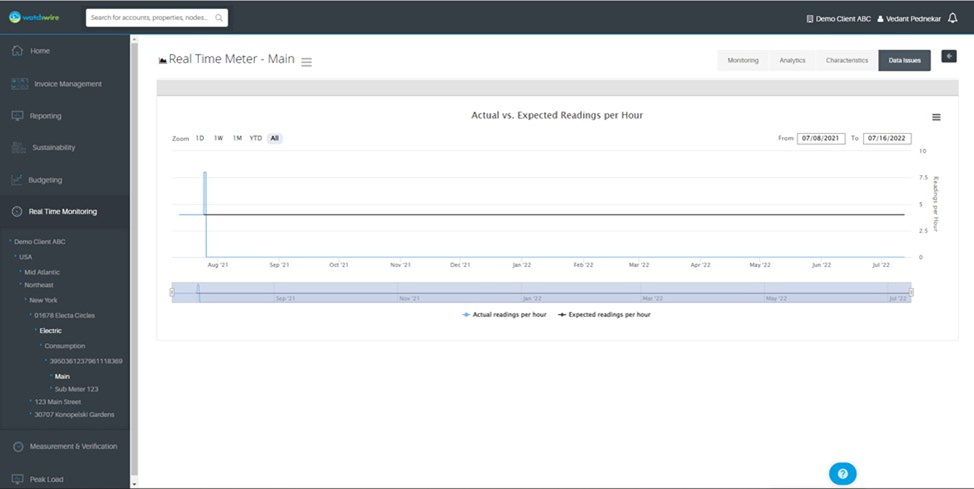
The graph will show actual readings received vs expected readings we should have received per hour for that meter. This will help you understand if the meter is receiving an accurate number of readings per hour or not.
Was this article helpful?
That’s Great!
Thank you for your feedback
Sorry! We couldn't be helpful
Thank you for your feedback
Feedback sent
We appreciate your effort and will try to fix the article