Table of Contents
BUDGETING
CREATING A NEW BUDGET
First, select the budgeting section in the left-hand navigation panel. Click Add New Budget.
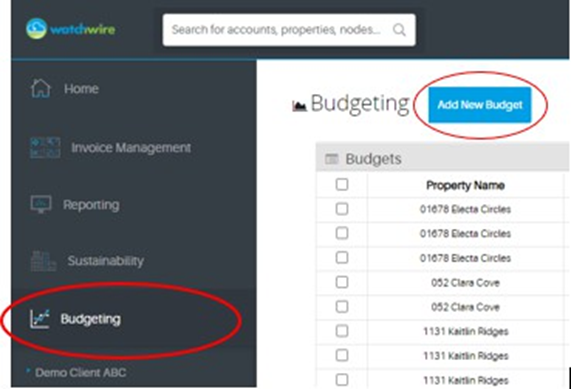
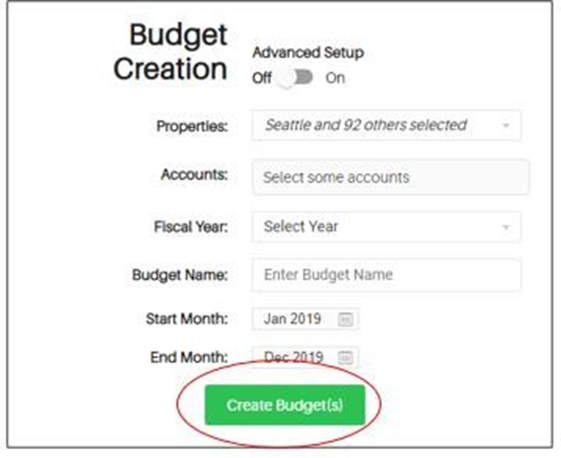
Please fill out the prompted fields to create a budget. Once all fields are filled, click Create Budget.
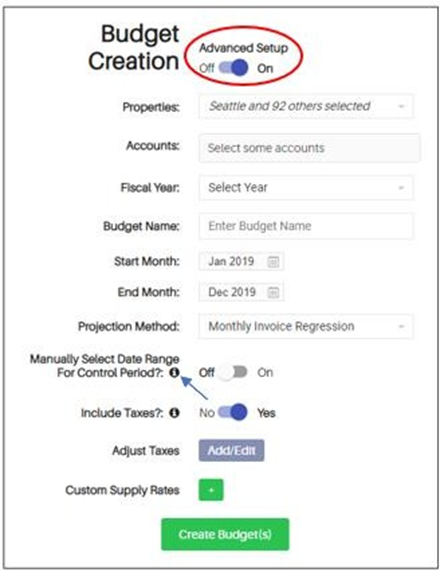
For an advanced budget, toggle on the “advanced budget” option. Fill out the additional fields and select Create Budget. For clarification on certain fields, hover over the ? symbol for further explanations.
AUTO CREATING BUDGETS
You can create multiple budgets for the same commodity at a given time. In addition, you can create budgets for all your commodities at a given time. This is referred to as a bulk budget creation. Bulk budgeting can be useful if you have multiple properties you need to create budgets for.
NAVIGATING BUDGET SCREENS
BUDGET LIST PAGE
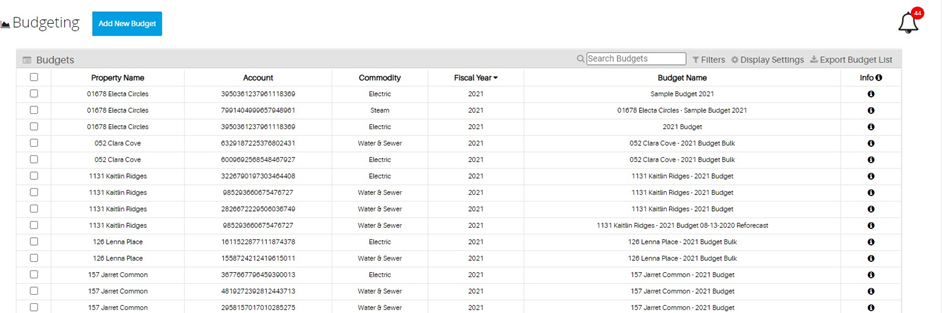
On the main budgeting module page, you will have a list of budgets created for your properties. Here you can select budgets to approve, delete, or filter through to organize your budgets.
BUDGET DISPLAY SETTINGS
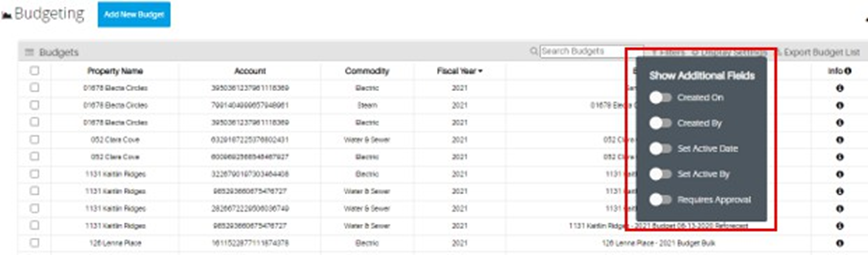
Hover over the gear symbol next to Display Setting to add additional fields to your budget list. This can help you sort your budget list and organize more efficiently through the fields available.
BUDGET FILTERS
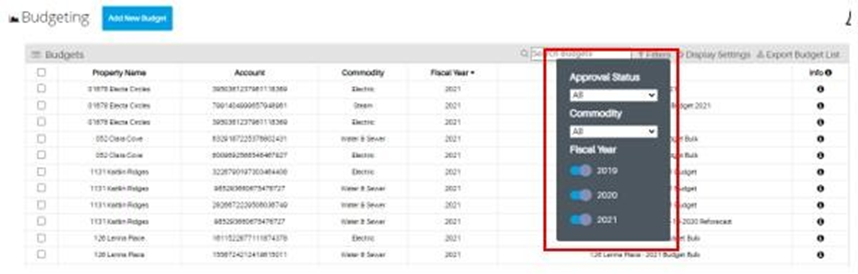
You can filter your budgets by selecting active/non-active, commodities, and different fiscal years.
BUDGET DETAIL PAGE
SUMMARY
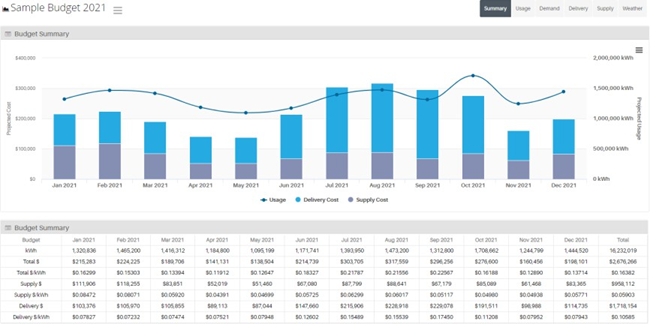
The budget summary page encapsulates the usage, demand, delivery, supply, and weather sections in one snapshot page.
USAGE
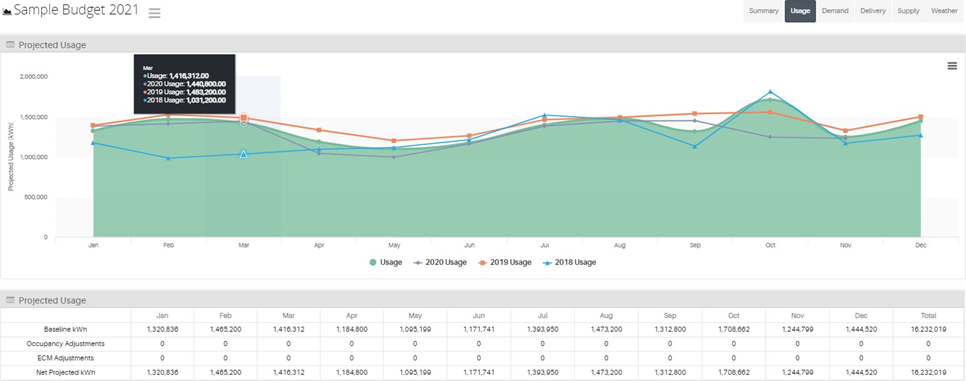
Usage projections are based on a multivariable regression analysis of monthly invoice data compared against daily temperature data, as well as day of week, season, operating hour, and hour of day correlations. WatchWire’s algorithm analyzes over 2 billion potential models and settles on the projection model with the highest total model adjusted R-squared value. Daily usage is projected for the budget period, then summed per billing period. The graph can help you visualize the projected usage trend.
DEMAND
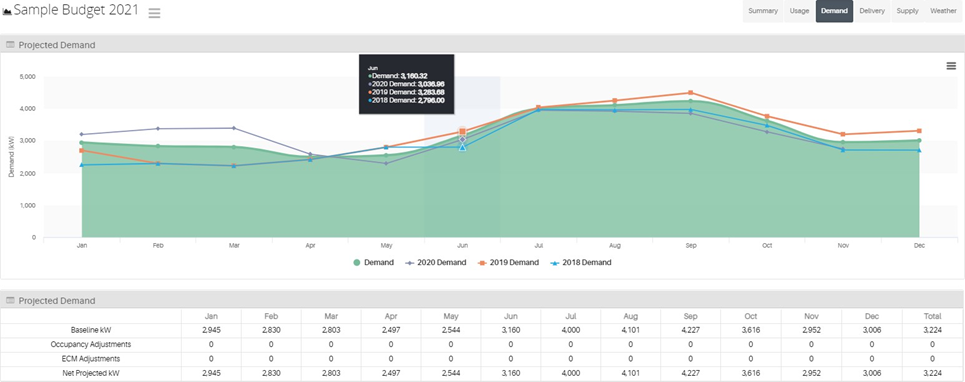
Monthly demand is based on a monthly regression model comparing demand against heating degree days, cooling degree days, and seasonality. The graph can help you visualize the projected demand trend.
DELIVERY
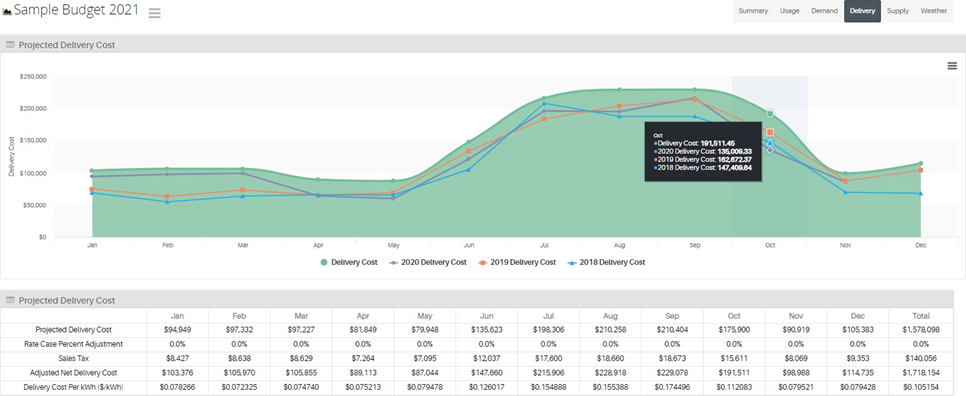
Monthly usage and demand projections are entered into WatchWire’s rate calculator to replicate current tariff rates inclusive of all delivery billing components. Known Public Utility Commission rate cases are included where/when applicable. The graph can help you visualize the projected cost trend.
SUPPLY
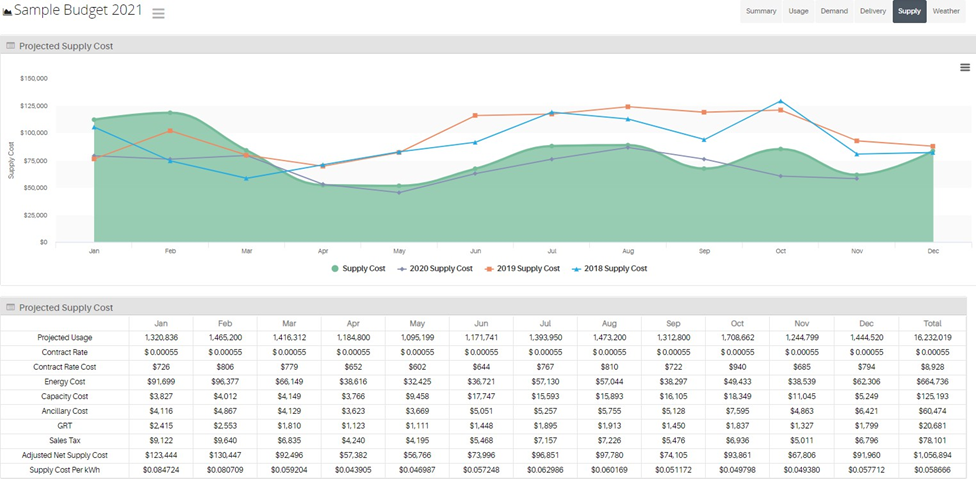
The projected supply costs are based on your supply contract with your third-party supplier (ESCO), which can be imported through the Supply Contract Import template. The table will highlight the contract rate, applicable pass-through rates, taxes, and rate per kWh. The graph can help you visualize the projected cost trend.
WEATHER
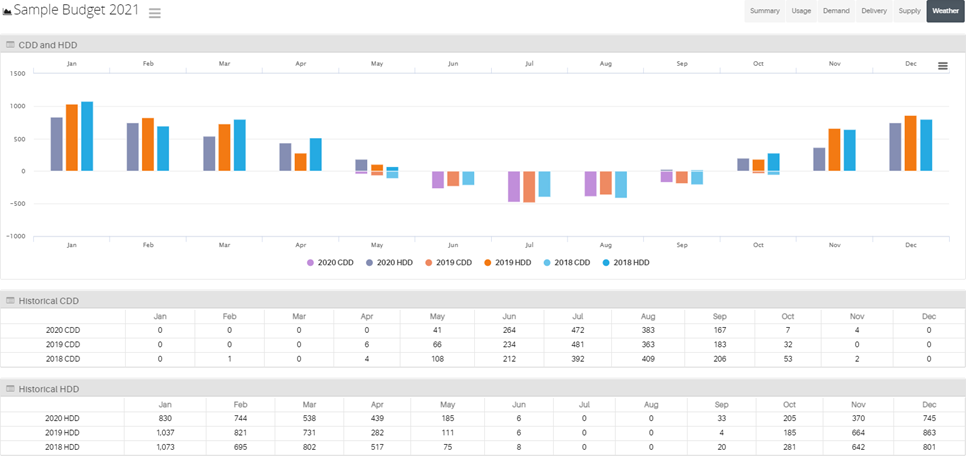
The Weather page highlights the property’s heating and cooling degree days per month, and the graph helps you visualize the weather trend from previous years.
EDITING & ADJUSTING BUDGETS
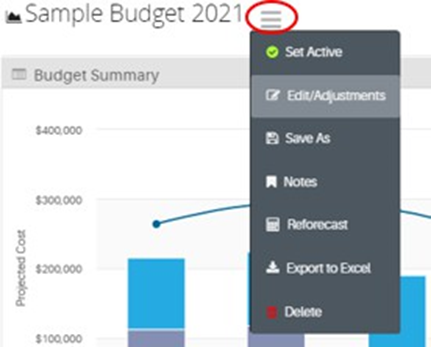
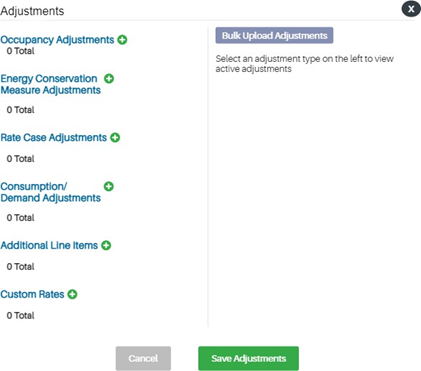
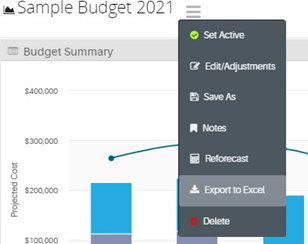
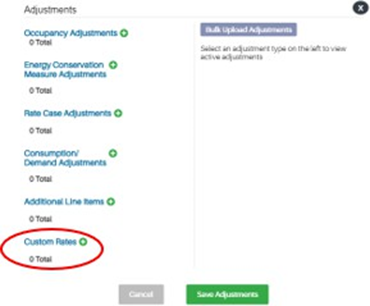
To edit/adjust your budget, hover over the hamburger symbol and select Edit/Adjustments.
OCCUPANCY ADJUSTMENTS
If your property has projected move ins/outs, this is where you would add them. Select the green plus sign and fill out the appropriate fields.
ENERGY CONSERVATION MEASURE ADJUSTMENTS
If your property has undergone any energy saving projects, this is where you would add them. Select the green plus sign and fill out the appropriate fields.
RATE CASE ADJUSTMENT
If applicable, you can add a percent rate case adjustment to your LDC costs based on the
utility’s projected delivery rate increase/decrease.
CONSUMPTION/DEMAND ADJUSTMENT
These are flat adjustments that can be added if needed.
ADDITIONAL LINE ITEMS
Line Items give you a way to add additional factors that might influence the delivery or supply cost of your project.
CUSTOM RATES
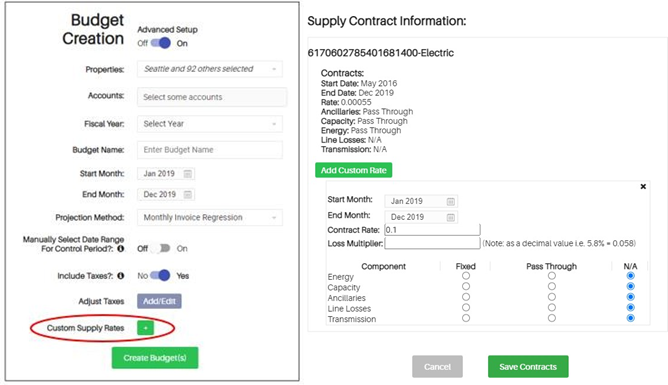
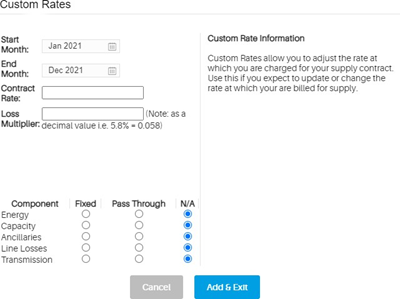
Custom Rates allow you to adjust the rate at which you are charged for your supply contract. Use this if you expect to update or change the rate at which you are billed for supply.
REFORECASTING
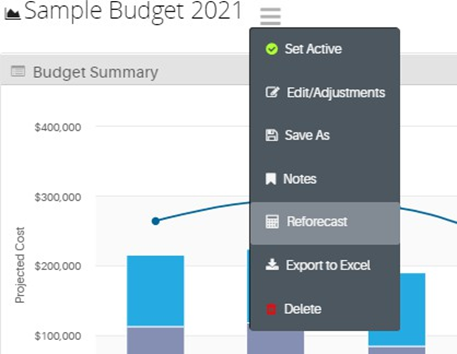
Reforecasting a budget will create a new version of the budget using the most current data. The original budget will remain intact. You can reforecast a budget in your working budget by hovering over the hamburger button, and select Reforecast.
You can also reforecast a budget from the budget list page, by checking the budget and clicking the reforecast button.

ADDING BUDGET NOTES
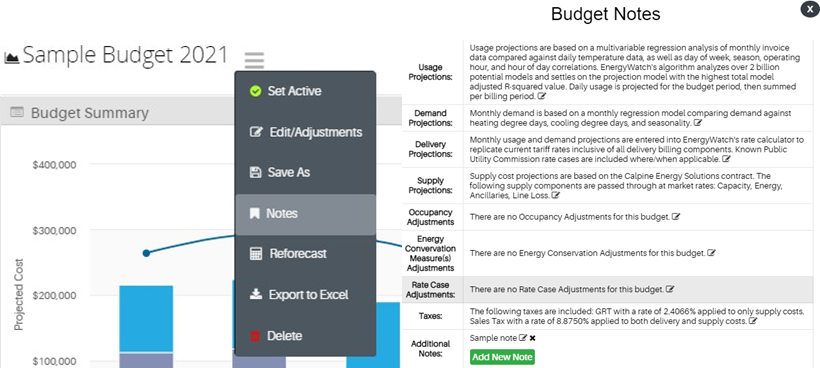
Hover over the hamburger button and select Notes. Here you can add additional notes for your budget.
SAVING BUDGETS
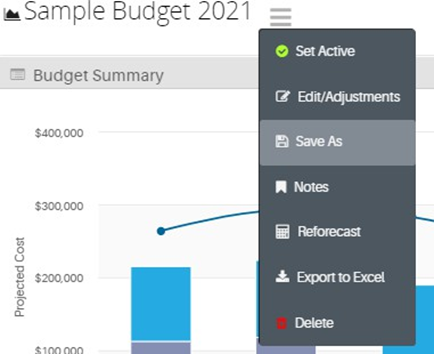
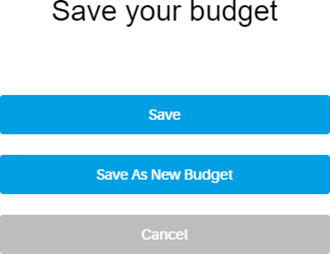
Hover over the hamburger button and select Save As. Here you can save over the existing budget or save as a new budget.
DELETING BUDGETS
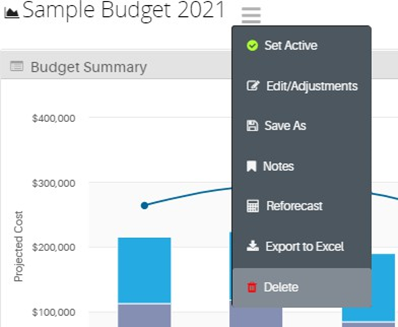
You can delete a budget in your working budget by hovering over the hamburger button and selecting Delete.
You can also delete a budget from the budget list page, by checking the budget and clicking the red delete button.

SETTING BUDGETS AS ACTIVE
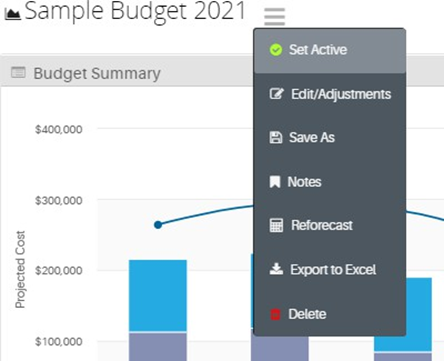
By setting a final budget as active, it will be the default budget that will compare against new data and be used for reporting purposes. All other draft budgets can be kept but will not be used for creating reports in WatchWire. You can set a budget active in your working budget by hovering over the hamburger button and selecting Set Active.
EXPORTING BUDGET DATA & IMAGES
You can export a budget to excel in your working budget by hovering over the hamburger button and selecting Export to Excel.
UPLOADING SUPPLY CONTRACT DETAILS
Custom Rates allow you to adjust the rate at which you are charged for your supply contract. Use this if you expect to update or change the rate at which you are billed for supply. You can add supply contract details in the advanced setting of budget creation.
You can add supply contract details in the working budget’s Edit/Adjustment section.
Was this article helpful?
That’s Great!
Thank you for your feedback
Sorry! We couldn't be helpful
Thank you for your feedback
Feedback sent
We appreciate your effort and will try to fix the article