Table of Contents
- GOAL TRACKING
- ENERGY STAR
- PEER COMPARISON
- INTERNAL COMPARISON
-
SUSTAINABILITY REPORTING
- WHAT IS SUSTAINABILITY REPORTING?
- HOW CAN WATCHWIRE SUPPORT MY COMPANY WITH SUSTAINABILITY REPORTING?
- WHAT DOES THE SUSTAINABILITY REPORTING LANDSCAPE LOOK LIKE?
- WHAT ARE THE TIMELINES FOR REPORTING?
- DO I NEED TO REPORT TO EVERY SUSTAINABILITY STANDARD, FRAMEWORK, BENCHMARKING SERVICE, OR INDEX THAT EXISTS?
- DOES WATCHWIRE GENERATE ANY SUSTAINABILITY PERFORMANCE REPORTS OR ANALYSIS FOR ME?
- REC’S
- USE CASES
- SUSTAINABILITY WIDGETS ON DASHBOARD
- EXCEL BASICS
The Tango Sustainability Module helps streamline, automate, and standardize your sustainability reporting process. The platform stores and analyzes all energy, water, waste, and emissions data, providing a single source of truth for your organization. With multiple integrations to LEED Arc, GRESB, and more, standardizing your sustainability reporting process is made easy.
More Sustainability Module Features:
Building Performance Benchmarking
Integration with Energy Star Portfolio Manager’s API
GRESB Premier Data Provider
Carbon Accounting
LEED Arc Integration
Renewable Energy Credit Tracking
GOAL TRACKING
Create and track sustainability goals over time using the Tango goal-tracking feature to monitor
your corporation’s sustainability performance
WHAT TYPES OF GOALS CAN I TRACK
You can track goals with respect to energy, water, carbon, and waste diversion, and measure performance versus the stated goal. Find out how to set emissions reduction targets in line with the Science Based Target Initiative (SBTi) here.
HOW CAN I SET AND TRACK PROGRESS TOWARDS A GOAL
To create a new goal, follow these steps:
Go to the Goal Tracking tab in the sustainability module.
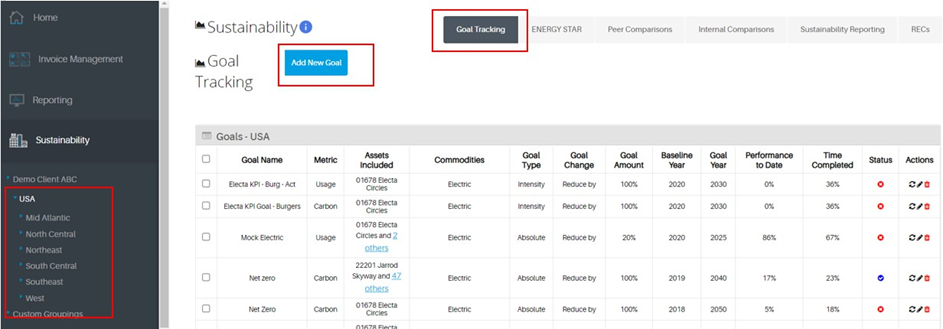
Click on "Add New Goal."
-
Fill in the following criteria:
Name the goal.
-
Select the type of goal: Intensity or Absolute.
Absolute targets aim to reduce GHG emissions by a set amount. For example, Company A sets a goal to reduce GHG emissions by 30% by 2030 relative to a 2010 base year.
An intensity target is a normalized metric that sets an organization's emissions target relative to an economic or operational variable. For example, Company A sets a goal to reduce GHG emissions by 30% per unit of output by 2030, relative to a 2010 base year.
Select the asset(s) this goal applies to
Select the metric that this goal is tracking: usage or carbon
Choose the Key Performance Indicator (KPI) and commodities (you can select all relevant ones).
Define the change type as either reduce by, increase to, or increase by.
Set the Baseline year and the Goal year.
Once you have set a goal, the tracking components provide graphical visualization with target lines, actual performance, and projected performance. It supports various commodities and new metrics, integrates goals across multiple properties, offers tracking on a monthly or yearly basis.
USE CASES
Sustainability Managers and Analysts, Energy Managers and Procurement teams, and individuals at the C-suite level will all find the Goal Tracking functionality to be particularly useful when it comes to tracking their company’s emissions or other metrics performance over time and identifying areas for improvement.
ENERGY STAR
ENERGY STAR is administered by the U.S. Environmental Protection Agency. Thousands of organizations—including nearly 40% of the Fortune 500®—partner with ENERGY STAR. Together with EPA, we deliver cost-saving energy efficiency solutions that protect the climate, improve air quality, and protect public health.
WHAT IS ENERGY STAR PORTFOLIO MANAGER
ENERGY STAR Portfolio Manager is an online tool created by the Environment Protection Agency (EPA) that you can use to measure and track energy and water consumption, as well as greenhouse gas emissions. The ENERGY STAR label is awarded to products and buildings that meet strict energy efficiency criteria, indicating that they use less energy and cause fewer greenhouse gas emissions than comparable products and buildings.
WatchWire integrates with Energy Star Portfolio Manager’s API, so you can automatically benchmark your data to comply with local laws. Whether or not your city or state requires ENERGY STAR benchmarking with your data, your property or portfolio can still benefit from voluntarily reporting to Portfolio Manager.
PREREQUISITES TO SETTING UP A CONNECTION WITH ENERGYSTAR PORTFOLIO MANAGER
To set up a connection with ESPM in WatchWire, you will have to share the properties with WatchWire in Portfolio Manager. Follow these steps to do so:
Log onto Energy Star Portfolio Manager (you need to have an existing account).
Send a contact request to “ece_energywatch_33011". To make a connection, go to the “Add Contact“ or “Add Organization” page, search for “ece_energywatch_33011", and send a “Connection” request. Once sent, please let us know so we can accept the invitation. After we accept your connection request, we will show up on your list of connected contacts.
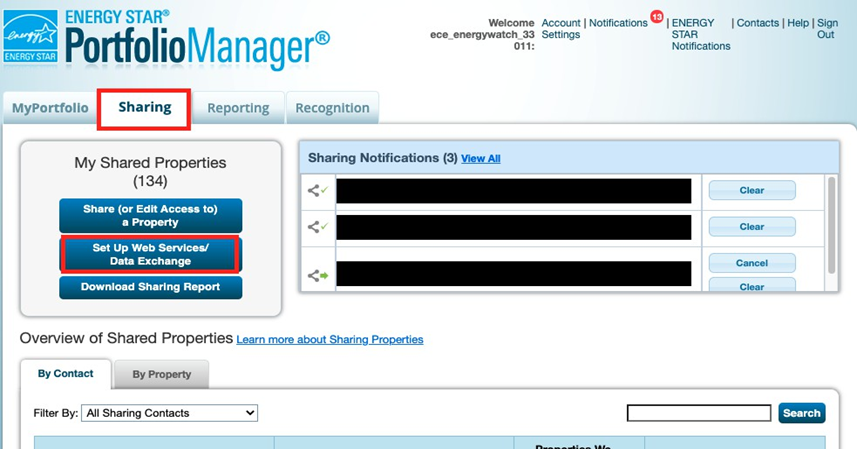
Once we accept, navigate to “Sharing” tab and click “Set Up Web Services/Data Exchange”:
-
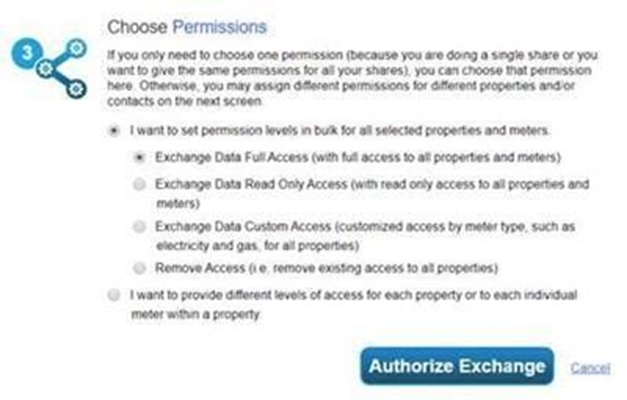
Choose EnergyWatch in step 1 (Select Web Services Provider (Account)), select your properties in step 2, and in step 3, select the first radio button option with “Exchange Data Full Access”, then click “Authorize Exchange”.
CONFIGURING A BUILDING TO SYNC WITH ENERGYSTAR PORTFOLIO MANAGER
To configure a building to sync with ESPM, navigate to the Invoice Management module. Using the hierarchy arrows, select the property you would like to sync. Select Asset Characteristics and then ENERGYSTAR on the right-hand side of the page.
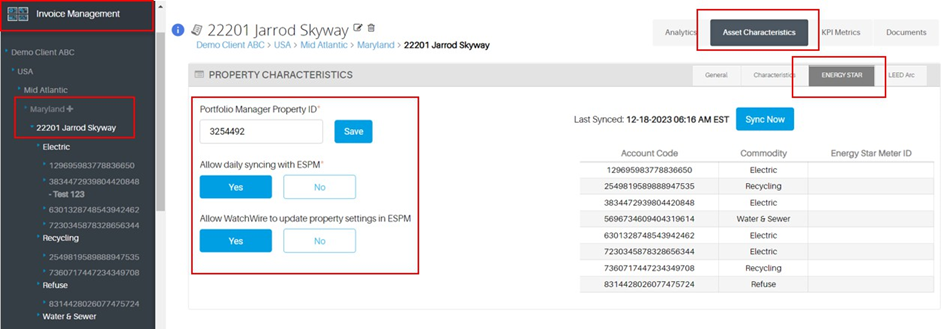
Enter and save the Portfolio Manager Property ID. Select “Yes” to allow daily synching with ESPM – this will allow WatchWire to update consumption data in ESPM. This is what allows data to be shown in the Sustainability section of WatchWire.
NAVIGATING THE SUSTAINABILITY HIERARCHY TO VIEW ENERGYSTAR DATA AND RESULTS
On the left-hand side of the page, select the Sustainability module to select different options in the hierarchy. Like the Invoice Management section, all data is wrapped up in each higher node.
To view ENERGYSTAR data, make sure ENERGY STAR is selected at the top of the sustainability module.
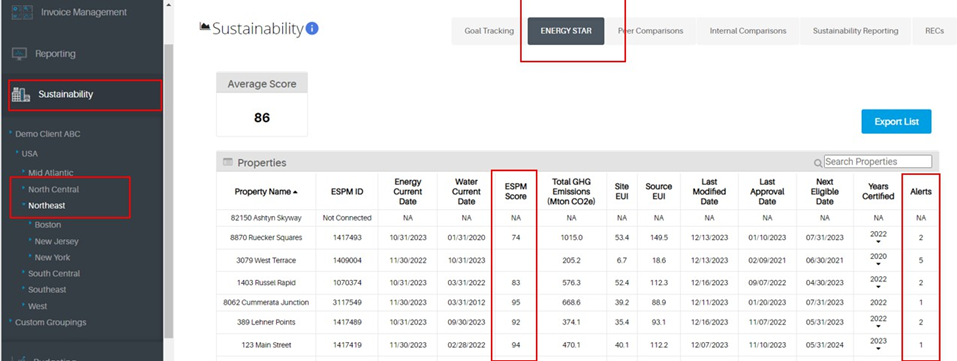
When you have any node above a property level node selected, your view will show your synced properties under that node with their ESPM ID, ESPM score, and a variety of other information from ESPM. On the far right, is a column “Alerts”. Click on the number to view the alerts.
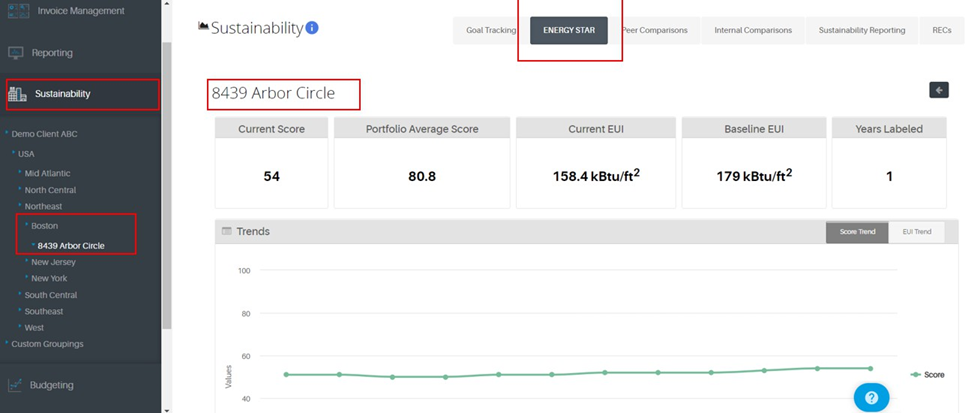
You can navigate to a property level view in two ways. From the above higher level node view (multiple properties underneath), you can click directly on one of the rows to view that property’s ESPM data individually. You can also navigate to the property level view by using the hierarchy nodes on the left-hand side.
SETTING UP THE ENERGY STAR DASHBOARD WIDGET
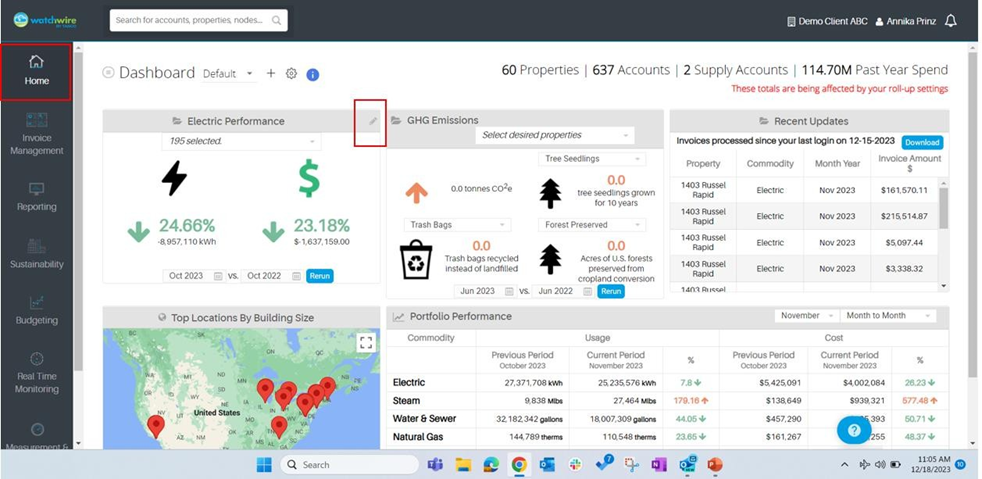
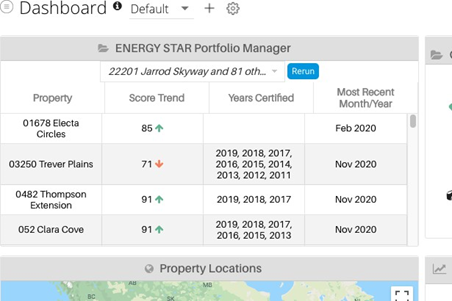
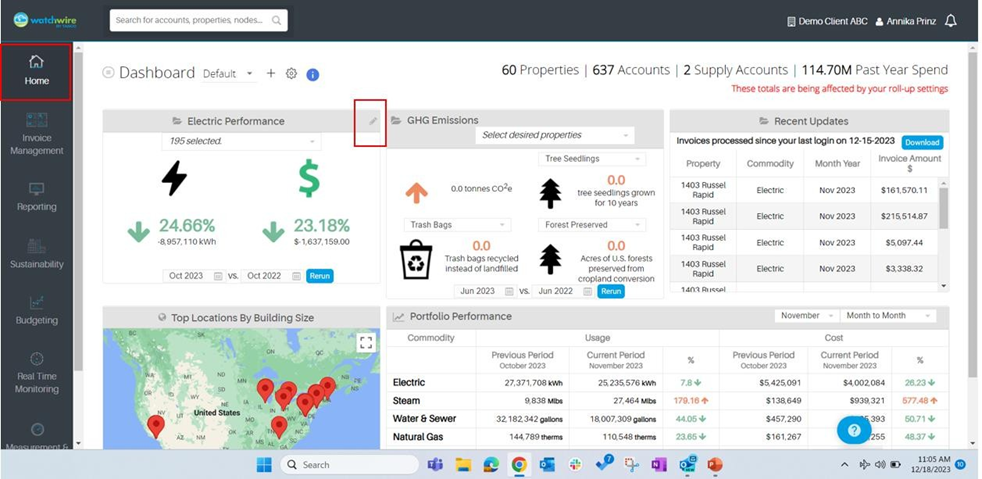
From the Home section, you can set up an ENERGY STAR dashboard widget. Hover over the top right corner of the widget you would like to change and click on the pencil icon when it appears.
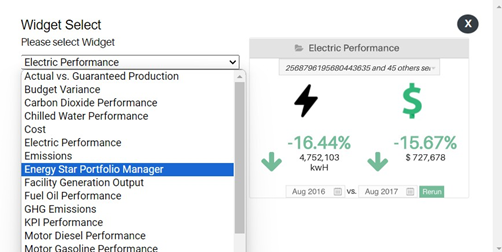
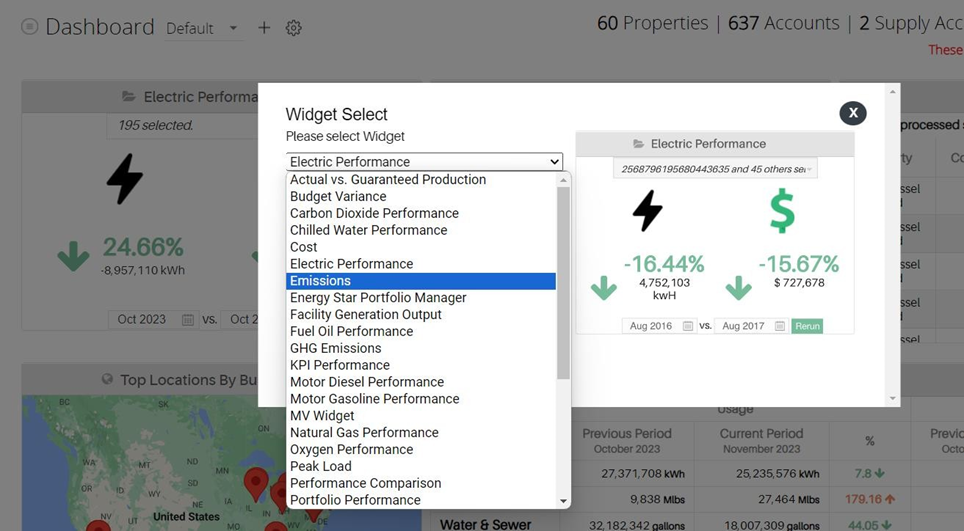
Then, select “Energy Star Portfolio Manager” from the drop-down list and save. The newly saved widget will now appear in your Dashboard. From here you can select different properties to quickly view high-level ESPM data.
RUNNING AN ENERGY STAR REPORT
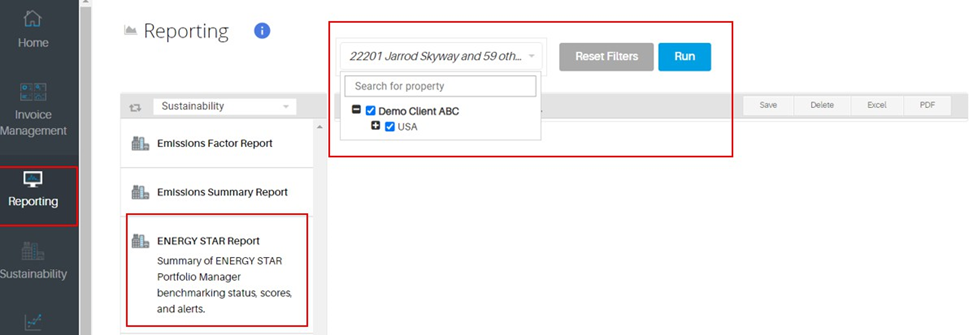
Navigate to the Reporting section. Scroll down to find the ENERGY STAR Report and select. Then, select the properties you want included in the report, and hit “Run”.
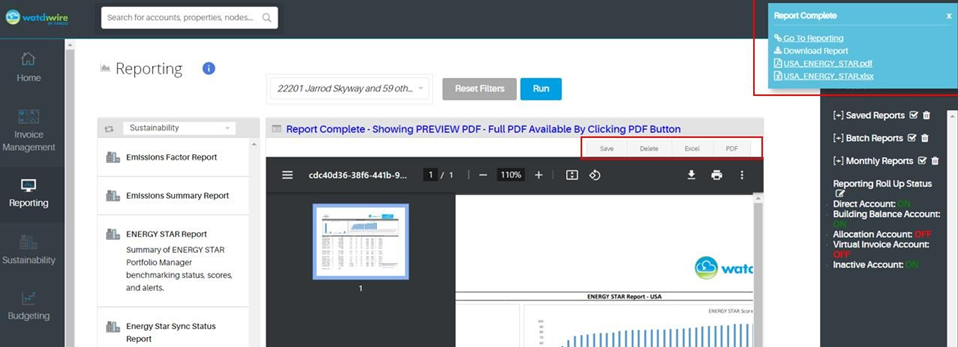
You will see a notification in the top right corner when the report is ready, and a preview will show up in the center of the page. From here, you can download and save the report in various formats.
PEER COMPARISON
HOW DO I COMPARE MY FACILITIES AGAINST MY PEERS?
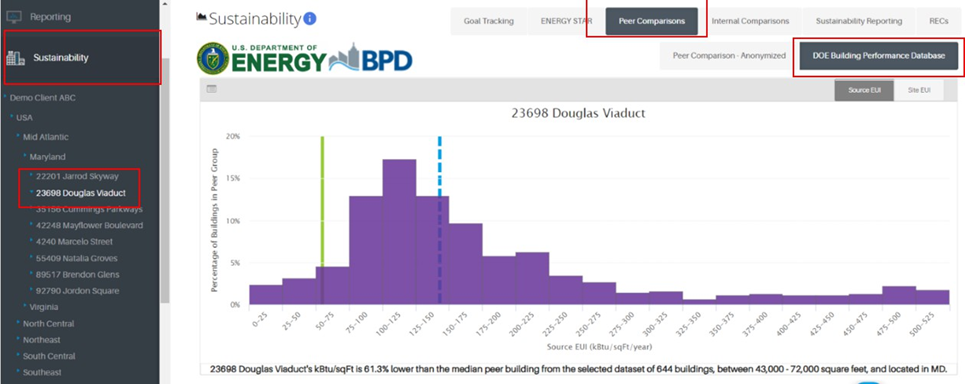
Go to the Peer Comparison tab on the Sustainability Module page
Select a property from the Sustainability node hierarchy on the left-hand side of the page. As you click on each node, any available nodes rolled up within it will appear.
You can choose to compare this property to an anonymous data set or to the Department of Energy (DOA) Building Performance Database (BPD).
To run comparisons on properties using the BPD make sure that you have selected “Building Performance Database” at the top of the page. The system will use the characteristics associated with this property (i.e. location, size) to determine peer building data to use for comparisons.
USING FILTERS IN THE BUILDING PERFORMANCE DATABASE
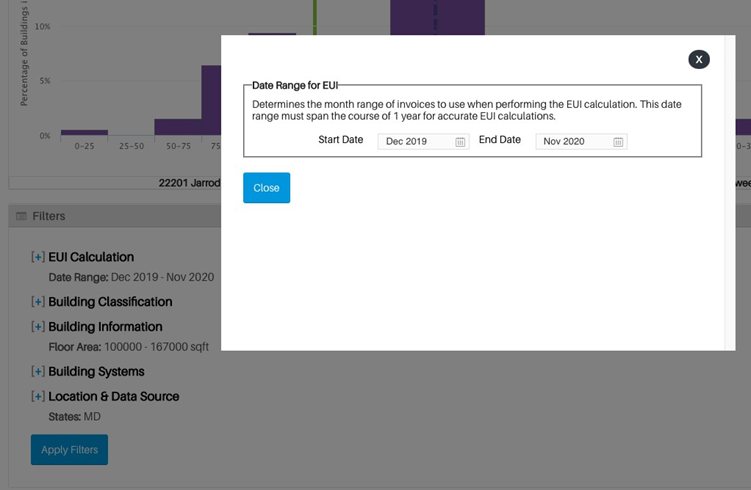
There are several filters you can also use to narrow the buildings included for comparison in the results. Select EUI Calculation to change the date range of your results.
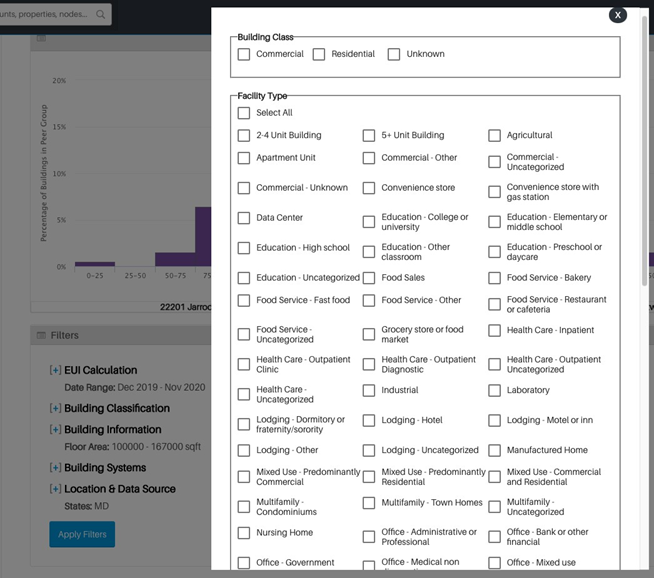
To add a building class or facility type, select “Building Classification”.
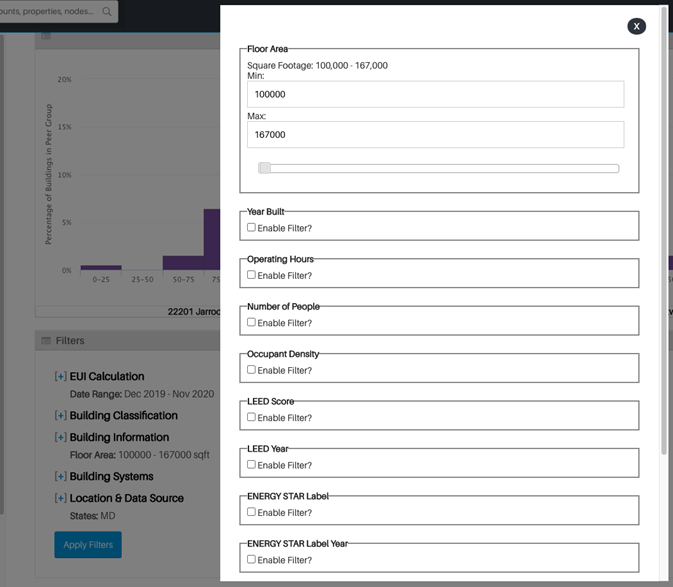
To factor in more specific building details, such as age, occupant density, etc., select Building Information. You will see options to enable various additional building information filters.
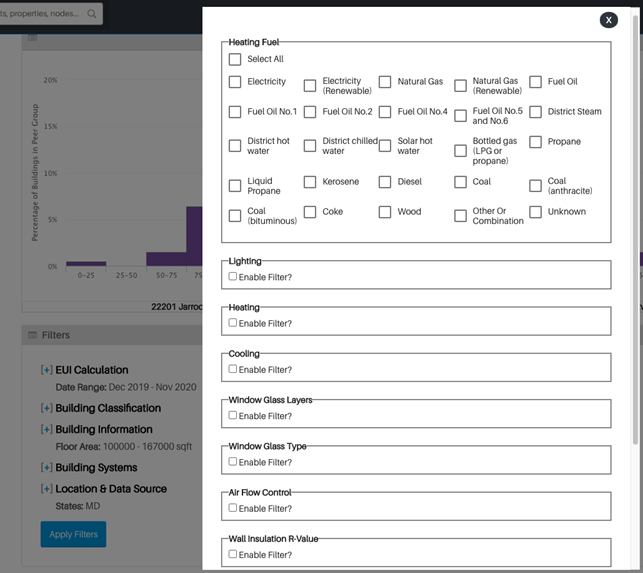
To filter with additional building systems such as lighting, window glass type, etc., select
Building Systems. You will see options to enable various additional building systems filters.
To include more specific location and data source information, choose Location & Data Source. Options will appear to enable more specific filters in this section as well.
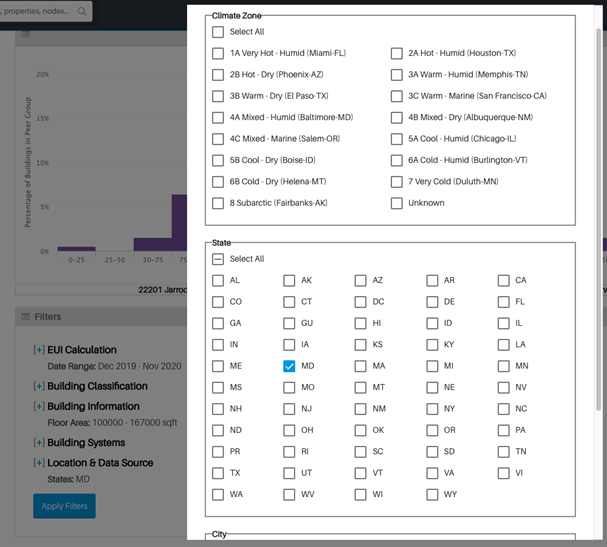
Once you have chosen any additional filters you wish to include, click on Apply Filters. The chart results will update based on the filters used.
USE CASES
Sustainability Managers and Analysts, Energy Managers, Facility Managers, Operations Managers and C-suite level executives will find the Peer Comparisons feature particularly useful.
INTERNAL COMPARISON
HOW DO I COMPARE MY FACILITIES AGAINST EACH OTHER?
Go to the Internal Comparison tab in the Sustainability Module Section
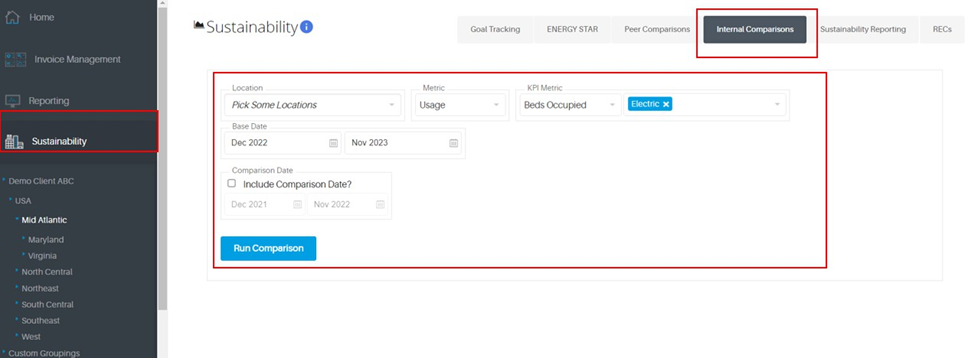
Choose the desired locations for comparison, selecting as many as needed.
From the second dropdown, pick the metric you want to compare across locations, e.g CO2 Emissions
Optionally, choose a Key Performance Indicator (KPI) metric from the next dropdown. Choosing a KPI metric for comparison is immensely helpful in the context of sustainability or any other data-driven analysis because it provides a common denominator that ensures a meaningful and fair comparison. Without a standardized metric you may end up comparing "apples with oranges," which can lead to misleading or inconclusive results. For example, the locations you choose to compare may differ in size, scale, or other variables. Using a KPI metric such as square footage helps level the playing field, making it easier to compare performance across different locations.
Select the commodity or commodities you wish to compare, e.g. Electric
Indicate the time period for comparison. To include comparison data for each location, check the "Include Comparison Date" box.
Finally, click "Run Comparison" to initiate the comparison process.
SUSTAINABILITY REPORTING
WHAT IS SUSTAINABILITY REPORTING?
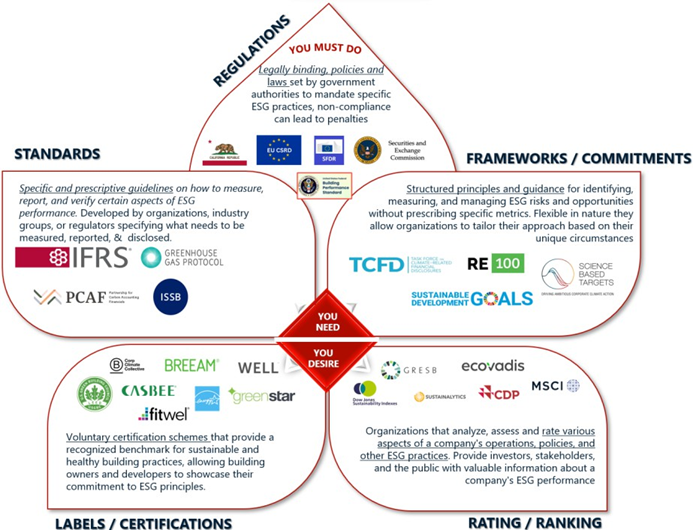
Sustainability reporting broadly involves disclosure of a company's environmental, social, and governance (ESG) goals and communicating the company's progress and efforts to reach those goals. While the social and governance aspects of ESG can usually be disclosed with qualitative information, the environmental aspect that requires data on GHG, water, waste, and energy is much more quantitative and that’s where WatchWire’s software comes into play.
HOW CAN WATCHWIRE SUPPORT MY COMPANY WITH SUSTAINABILITY REPORTING?
WatchWire generates the necessary quantitative energy and sustainability data that companies must provide in their sustainability reports. Furthermore, WatchWire’s Sustainability Reporting Integration features are designed to provide an effortless and efficient approach to sustainability reporting. By integrating directly with ENERGY STAR Portfolio Manager, LEED Arc, GRESB, and others, WatchWire eases the process of reporting to global standards and frameworks that exist.
WHAT DOES THE SUSTAINABILITY REPORTING LANDSCAPE LOOK LIKE?
WHAT ARE THE TIMELINES FOR REPORTING?
Various sustainability standards and frameworks may have different reporting timelines, ranging from annual to periodic or event-driven reporting. Staying informed and aligned with these diverse timelines is essential to ensure timely and accurate reporting, demonstrate commitment to sustainability goals, and maintain compliance with industry-specific requirements.
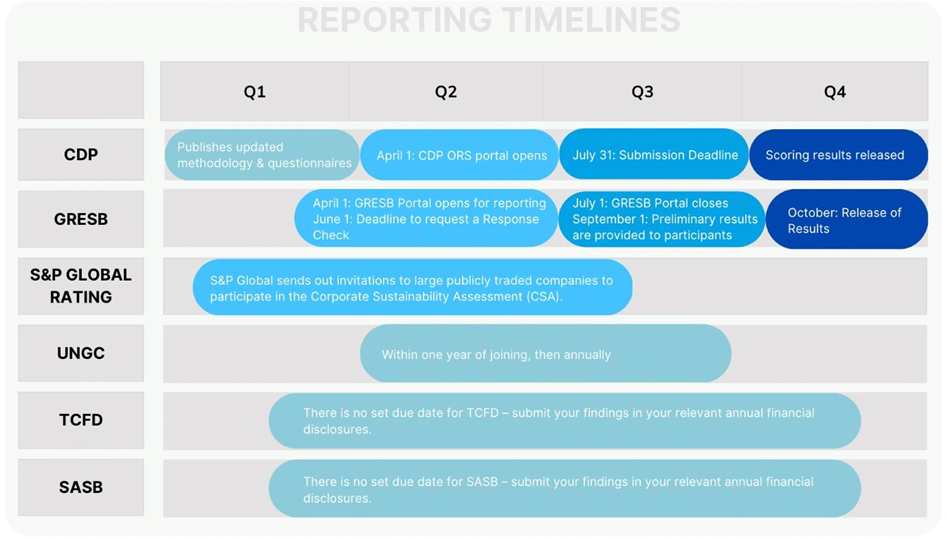
Find more information around the timelines for reporting here.
DO I NEED TO REPORT TO EVERY SUSTAINABILITY STANDARD, FRAMEWORK, BENCHMARKING SERVICE, OR INDEX THAT EXISTS?
No, the decision of which initiatives to engage with should be based on your organization's specific goals, industry, stakeholders, and the relevance of these frameworks to your operations. Sustainability reporting can be a complex and resource-intensive process, so it's important to prioritize those that align most closely with your company's values and objectives. Read this article to understand which reporting frameworks/standards and ratings might be most relevant to your organization.
Furthermore, choosing which reporting initiatives work best for your organization can be guided by local laws and regulations that directly impact your business. For example, in some jurisdictions, there are regulations that require building owners to benchmark their energy data using recognized frameworks like GRESB (Global ESG Benchmark for Real Assets) or LEED (Leadership in Energy and Environmental Design).
DOES WATCHWIRE GENERATE ANY SUSTAINABILITY PERFORMANCE REPORTS OR ANALYSIS FOR ME?
Yes, there are several reports you can leverage under the Reporting Module, by filtering for
“Sustainability”. These include:
Emissions Factor Report: Provides the emission factors for selected commodities based on site locations. An emissions factor is a coefficient that describes the rate at which a given activity releases greenhouse gases (GHGs) into the atmosphere.
Emissions Summary Report: Tracks changes in usage and emissions for selected properties and commodities (Electric, Natural Gas, and Steam). This report is detailed by property/commodity and summarized with charts.
ENERGY STAR Report: Summary of ENERGY STAR Portfolio Manager benchmarking status, scores, and alerts.
Energy Star Sync Status Report: Summary of ESPM sync status compared to WW data available.
Facility Comparisons Report: Compares consumption/costs/demand on a total or per KPI basis across a selection of properties for a given current and comparison time period.
GRESB Template: Used to collect asset-level information in the GRESB format. This report can be uploaded to the GRESB Assessment Portal.
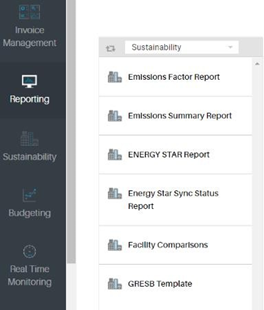
Another useful report is the Sentence Filter report, which you can find under the reporting tab. This provides almost any essential information you might need on your properties. It's like a tailored search engine for sustainability data.
REC’S
WHAT IS AN REC?
Renewable energy generated on a mass scale by wind farms, solar farms, or hydroelectric dams can be procured from an energy supplier or harnessed in the form of renewable energy credits (RECs) or green tariffs. Renewable energy credits are tradable, non-tangible commodities that represent proof that 1 MWh of electricity was generated from a renewable energy resource
and was then fed into the shared system of power lines that transport energy. Companies may purchase renewable energy credits along with their electricity, and the RECs certify that a certain amount of the electricity was from a renewable source.
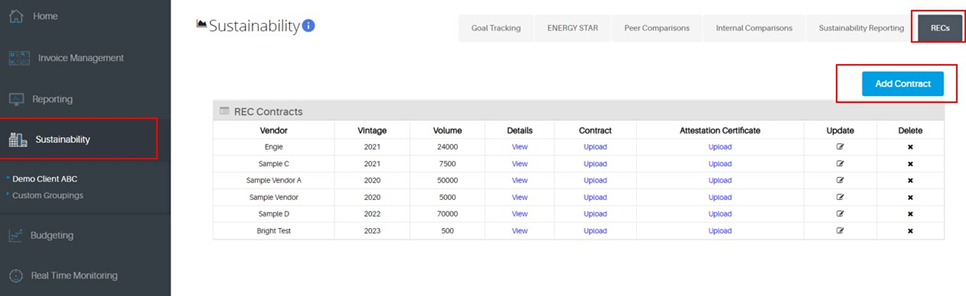
HOW DO I TRACK MY REC’S?
Navigate to the REC’s tab under the sustainability module and select “Add contract”.
WHY SHOULD I TRACK MY REC'S?
With the rise in net zero emissions goals as well as national building performance standards, onsite renewable generation or RECs are becoming widespread. The issue, however, is that renewable production data exists among various platforms, making tracking and reporting the performance of your renewables a challenge. WatchWire allows you to view the percentage of your electricity consumption that is renewable vs. purchased from the grid, incorporating any purchased RECs from contracts, on-site generation, and purchased electricity from the grid obtained from your utility bills.
USE CASES
Energy Managers and Procurement teams will find our REC tracking features to be particularly useful.
SUSTAINABILITY WIDGETS ON DASHBOARD
CUSTOMIZING YOUR DASHBOARD
You can personalize your dashboard to provide graphical top-level views of your most important sustainability and energy-related data. For example, you can view summaries of your carbon dioxide performance, emissions, Energy Star Portfolio Manager, GHG emission, and more from your homepage.
Hover over the top right corner of the widget you would like to change and click on the pencil icon when it appears.
Select any of the following options from the drop down menu.
EXCEL BASICS
DOWNLOADING AND ANALYZING AN EMISSIONS INVENTORY
To download and analyze an emissions inventory from the Watchwire Sustainability Module, follow these steps:
Log onto the WatchWire Platform
-
Navigate towards the "Reporting" section and select the “Sentence Filter” report in the left side bar.
Choose the commodity types you want to include in the report, such as electric, natural gas, and water.
Specify the units of measurement you're interested in for an emissions inventory, usage and carbon emissions are the most relevant.
Select the properties relevant to your analysis.
Define the time period you want to analyze for the emissions inventory.
Generate the emissions report based on your selections.
Download the report as an Excel file for further analysis.
Navigate to the "Sequential Data" tab on the Excel spreadsheet, which helps you identify any data gaps or inconsistencies in the emissions data.
Proceed to the "Pivot Table" tab
-
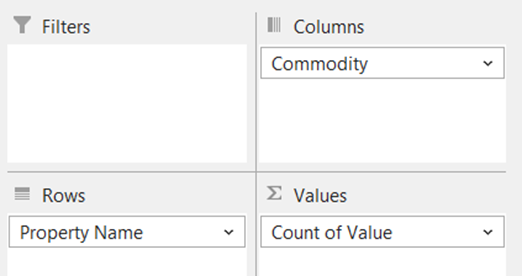
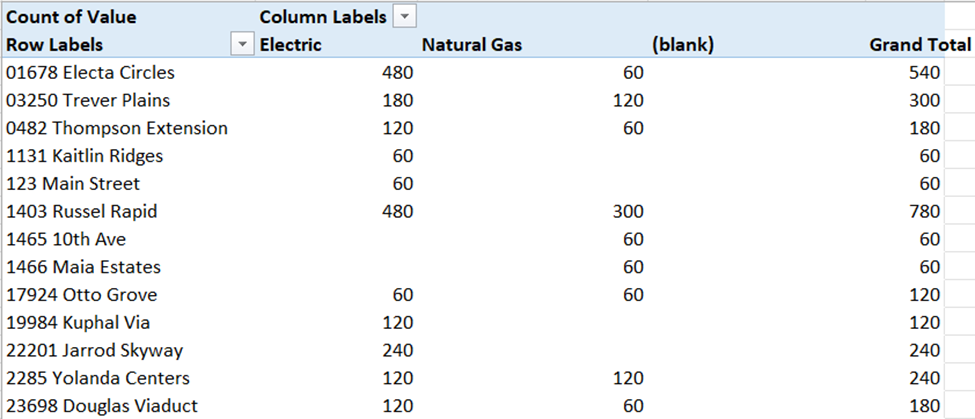
Click on "Insert Pivot Chart" to start your analysis on a new excel sheet. Analysis 1 (Usage for Each Commodity):
In the Pivot Table settings, place “Property Name” under the "Axis" field.
Place “Value” under the "Values" field and change it to sum the values.
Place “Commodity” under the “Legend” field to visualize usage for each commodity.
Analysis 2 (Scope 1, Scope 2 and Scope 3 Emissions):
Copy and paste the table above.
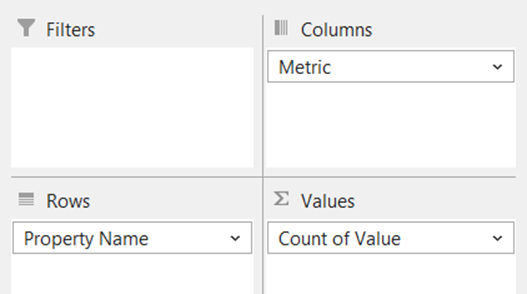
Modify the “Legend” field from “Commodity” to “Metrics” to analyze Scope 1,2 and 3 emissions.
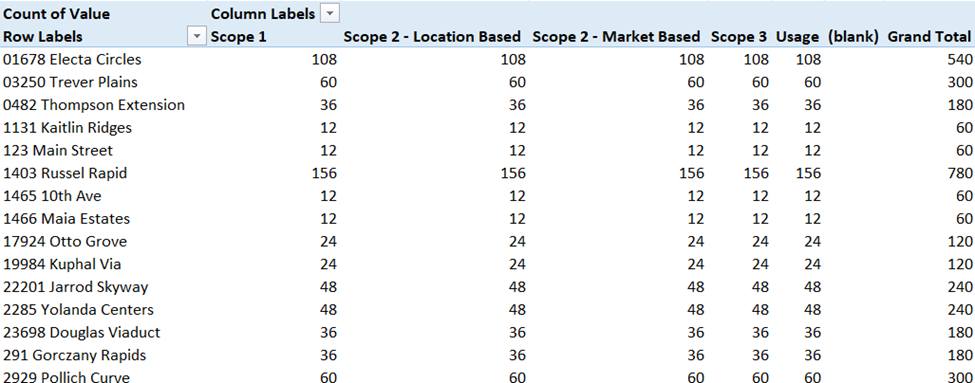
To further refine your analysis: You can filter the data by unit and add units relevant to the metric you are examining. For example, use "Therms" for natural gas and "KWh" for electric, depending on your specific analysis goals.
By following these steps, you can effectively download and analyze emissions inventory data from the WatchWire Sustainability Module for various commodities and metrics, including usage and emissions.
Was this article helpful?
That’s Great!
Thank you for your feedback
Sorry! We couldn't be helpful
Thank you for your feedback
Feedback sent
We appreciate your effort and will try to fix the article