Table of Contents
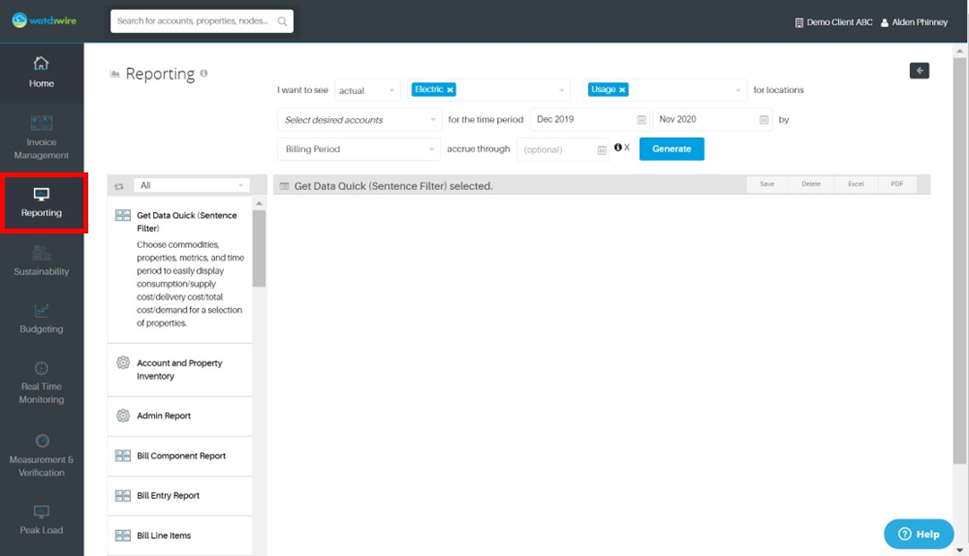
WatchWire contains a wide variety of reports to help you analyze and distribute your energy and sustainability data. This section provides an overview of how to run, schedule, and distribute WatchWire out-of-the-box reports. First, navigate to the Reporting section found on the left side navigation bar.
FILTERING AVAILABLE REPORTS
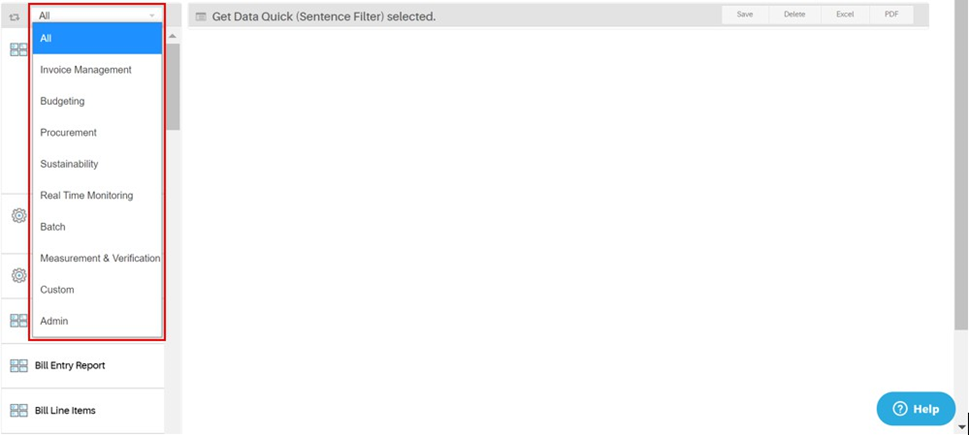
Reports are available in categories corresponding to modules within WatchWire. Reports can be filtered from the drop-down menu on the left of the Reporting section, with “All” selected by default. When a report category is selected, you will only see reports that correspond to that module or function.
Depending on your modular subscription, you may have access to all or some of the following reports:
| Account Inventory Report | Invoice Image Batch |
|---|---|
| Admin Report | KPI Report |
| Budgeting Aggregated | Missing Bills Report |
| Facility Comparisons Report | M&V Report |
| Bills Overdue Report | Outstanding Balances Report |
| Bill Entry Report | Portfolio Analysis |
| Bill Line Items Report | Position Report |
| Budgeting Report | Procurement Performance Report |
| Simple Budget Variance Report | Quarterly Usage Comparison |
| Comprehensive Budget Variance Report | Variance Report |
| Invoice Line Items Report | Sentence Filter Report |
| Competition Report | Supply Contract Report |
| Consumption Profile | Trend Analysis |
| Cost Profile | Unit Cost Trend Report |
| Demand Profile | Usage Comparison Report |
|---|---|
| Energy Star Report | User Activity Report |
| Estimated Statements | Utility Variance |
| Four Quadrant Executive Summary | Waste & Recycling |
| GHG | Weather Report |
| GRESB Report | YOY, YTD, MOM Overview |
| Invoice Data |
New reports are added to WatchWire regularly, so please let us know if there are any missing reporting capabilities that would be helpful for your organization.
RUNNING REPORTS
Once you have selected a report to run, you can use the filters to determine the scope of the report. Some reports have few filters, such as Node/Property, Commodity, and Date as in this example report below.
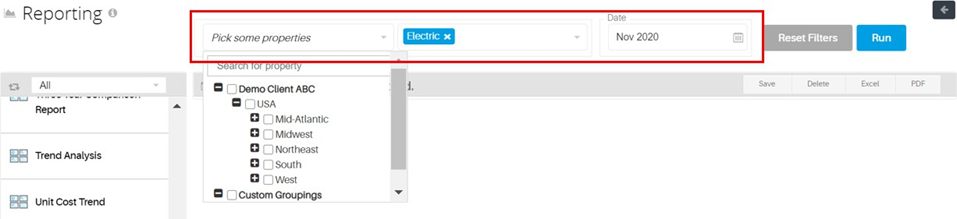
Other reports have more advanced filtering options to help you select and sort through the data you need.

Once you have selected your report and filters, click the blue Run button. Depending on the report and amount of data selected, it can take anywhere from a few seconds to a few minutes
to run. If you navigate away from the page to other sections of WatchWire, you will be notified via a pop-up when the report is ready to display.

EXPORTING REPORTS
Reports can be displayed in the platform, as well as exported to PDF and to Excel. To export a report, click on the Excel or PDF options once the report has generated to download it to your computer.
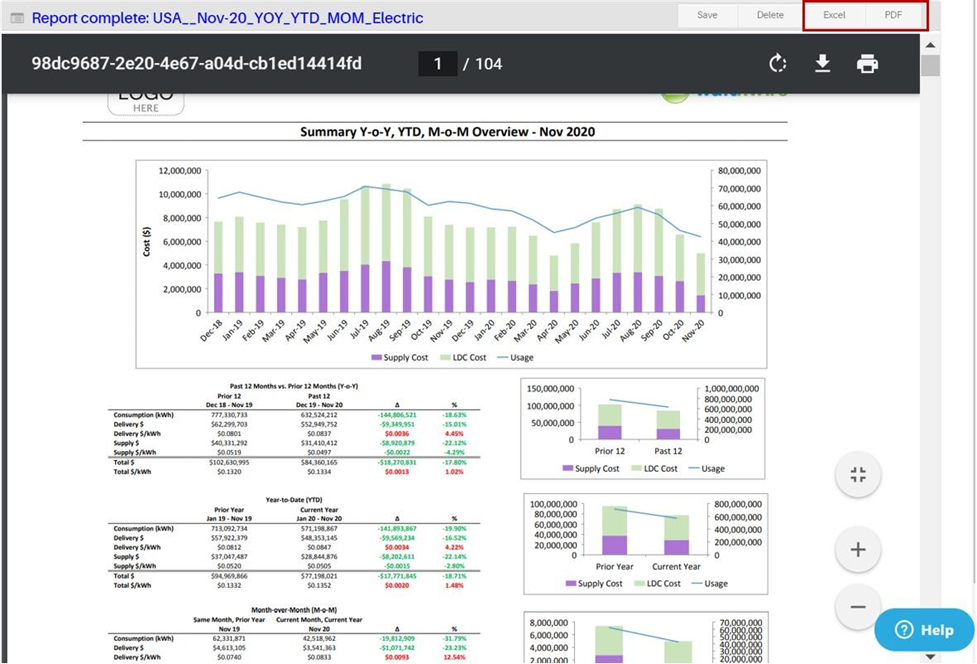
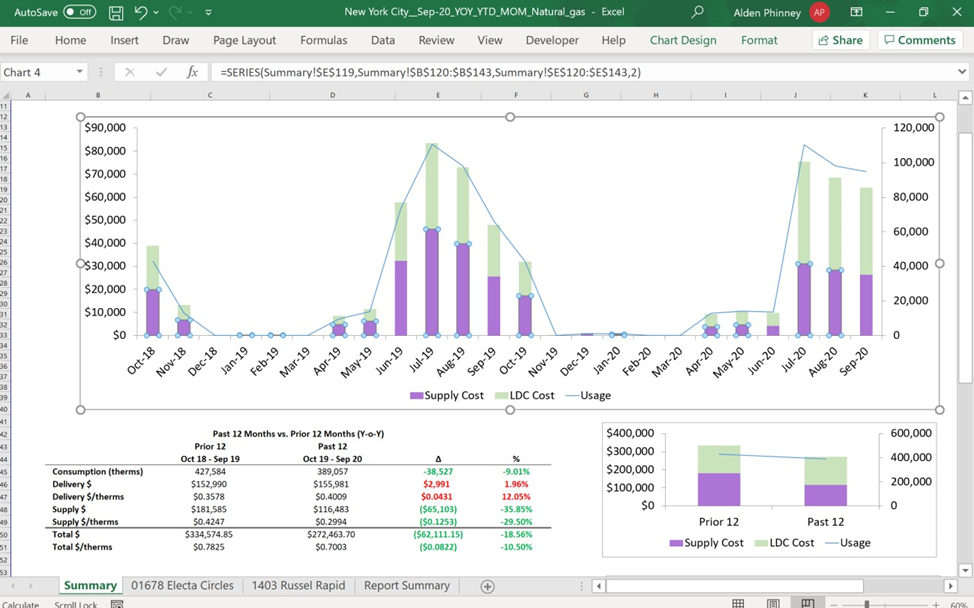
Reports exported to Excel hold their native formatting, so graphs will update according to data updates, formulas will display in most instances, and modifications will flow through to other parts of the report.
AUTOMATING REPORT GENERATION AND DISTRIBUTION
Please contact your Customer Success Manager for configuration.
SAVED REPORTS
Reports can be saved in WatchWire and accessed for future reference. To save a report, click the Save button once the report has generated.
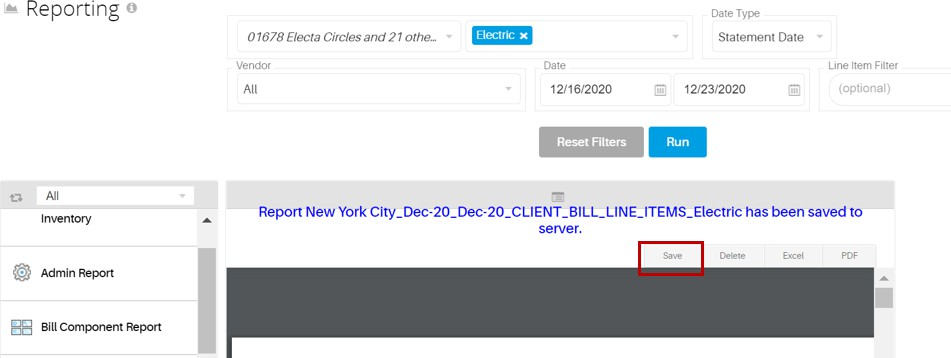
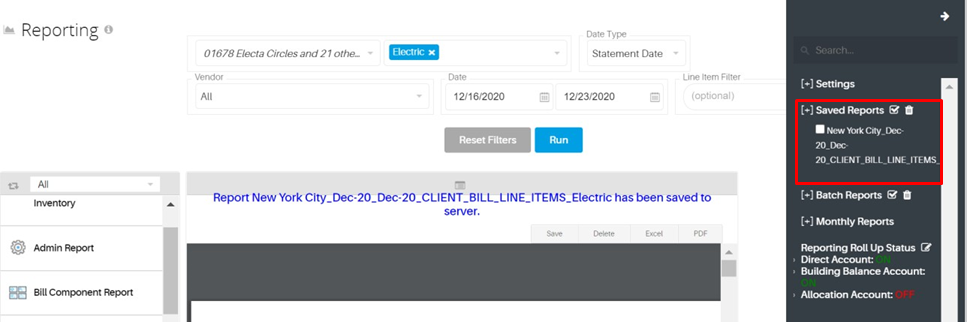
Access saved reports from the side bar menu, clicking on the arrow, then unfurling the Saved Reports folder.
REPORT SETTINGS & SIDEBAR
For advanced settings and saved reports, click on the arrow at the top right of the reporting section to access the sidebar menu.
BATCH REPORTS
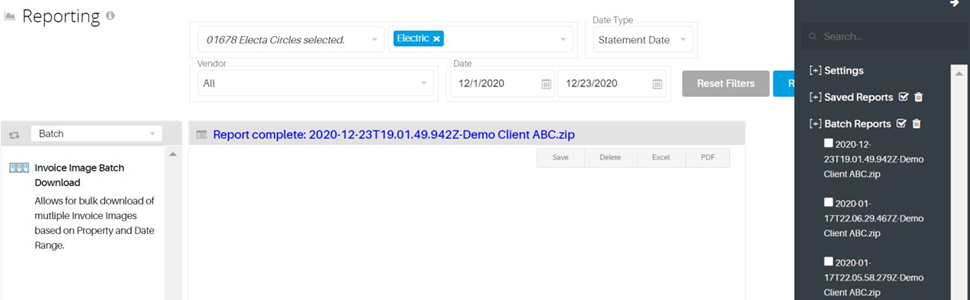
For easy auditing and dissemination of invoices, WatchWire can produce an Invoice Image zip file. To run the report, select the Invoice Image Batch Download Report, select filters for the invoices you would like reviewed, and run the report. The invoice images will be sent as a Zip file to your email, and can additionally be downloaded via the Sidebar.
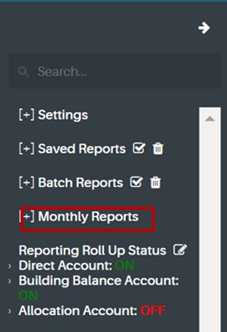
MONTHLY REPORTS
Monthly scheduled reports can be accessed, viewed, and downloaded via the sidebar. Reporting Roll Up Status
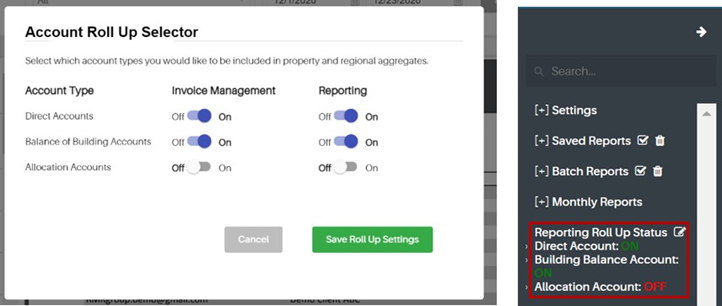
For clients with tenant spaces, Advanced Options to modify which Accounts are displayed in WatchWire analytics and reports can be modified from the sidebar. Click the notepad next to Reporting Roll Up Status, then select options from the pop-up window.
GET DATA QUICK/DATA EXPORT
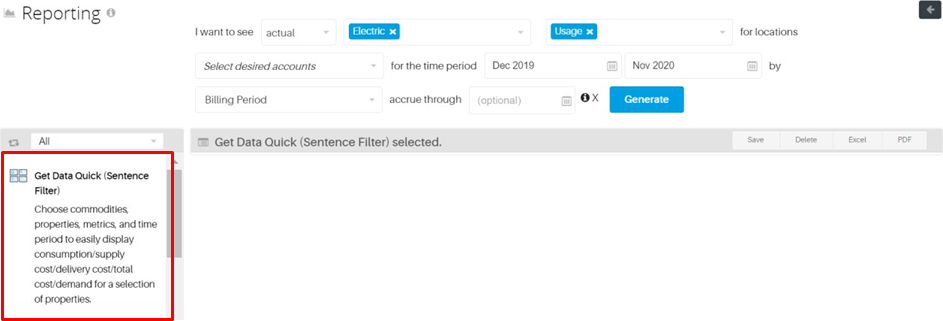
Through the Get Data Quick Sentence filter feature, WatchWire users can easily pull data for properties and nodes to enable quick analysis in Excel. The Get Data Quick feature is the first report in the Reporting section, accessible from the left side navigation bar.
Using the filters, data can be subset along factors such as:
Actual or Budgeted Data
Electric, Natural gas, or any other commodity in your portfolio
Usage, demand, cost, weather normalization (HDD/CDD), carbon emissions
Property, node, or account
Custom time periods
Billing Periods or Calendarized Months
Accruals
WatchWire maintains default emissions factors from multiple standard sources, per below:
-
Electric:
Scope 2 Location – EPA eGRID subregion (USA), IEA Emissions Factors (International). eGRID factors are updated as applicable. IEA factors are typically updated Q4 of each year.
Scope 2 Market – hierarchy per GHG Protocol Scope 2 Guidance, with default residual factors from Green-e Residual Mix Emissions Rate Tables for US locations
Scope 1 ( e.g., Natural Gas, Fuel Oil, Propane) and other Scope 2 ( e.g., steam, chilled water) – EPA Emission Factors for Greenhouse Gas Inventories 2021.
The default Global Warming Potential used in WatchWire is the Fifth Assessment Report published by Intergovernmental Panel on Climate Change.
Users subscribing to WatchWire’s Sustainability module can set their own custom emissions factors by commodity, node, and/or account. Users can also set their own custom Global Warming Potential if they want to utilize a different version of IPCC.
Our Emissions Factor report provides the applied emission factors for selected commodities based on site locations over selected time periods, whether you’re using WatchWire’s default factors or your own custom factors.
Was this article helpful?
That’s Great!
Thank you for your feedback
Sorry! We couldn't be helpful
Thank you for your feedback
Feedback sent
We appreciate your effort and will try to fix the article