Table of Contents
INVOICE MANAGEMENT
NAVIGATING THE CONTAINER HIERARCHY
First, navigate to the Invoice Management module found on the left-hand side’s navigation bar. Each property in WW is listed with the option of organizing them by a specific internal grouping or hierarchy.
CREATING CUSTOM GROUPINGS
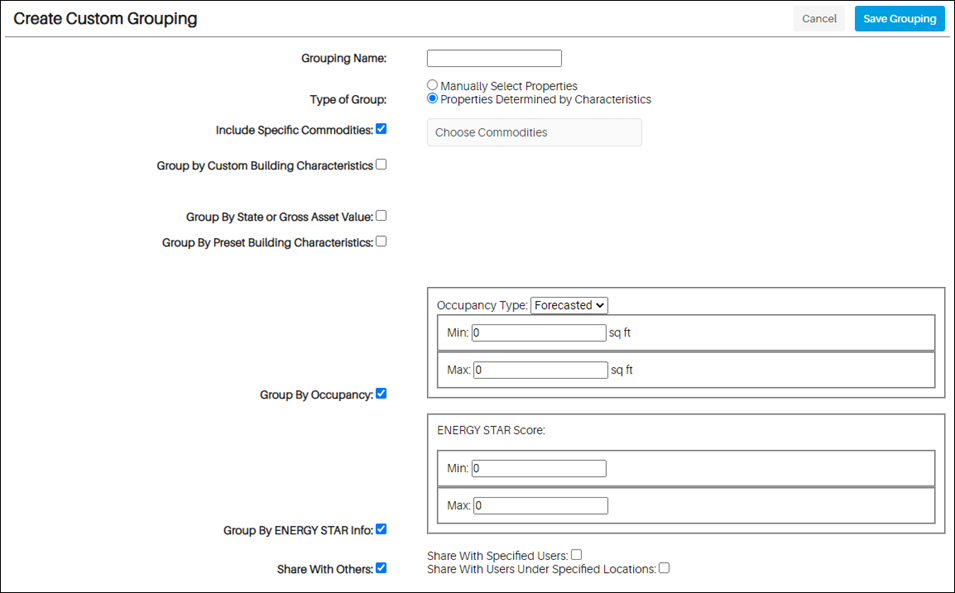
Custom groupings can be created by hovering over your username on the top right corner. From the dropdown, click on Custom Groupings, then Create New Grouping.
Fill out the details: grouping name, type, characteristics, or properties. Groupings can be created by manually selecting properties or by including subsets of properties determined by their Characteristics. You can then select if you would like to share with other users before saving the grouping.
PORTFOLIO ANALYTICS
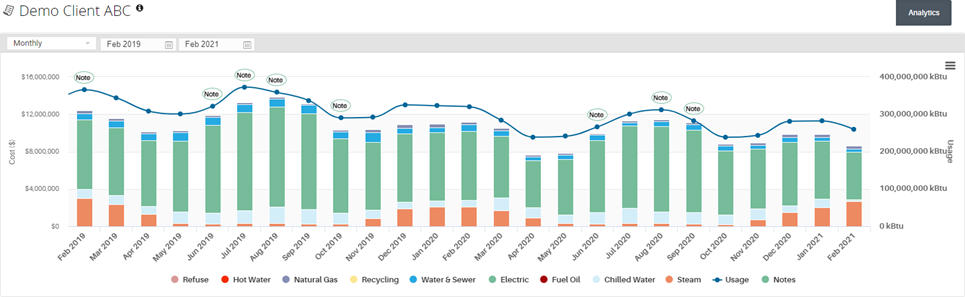
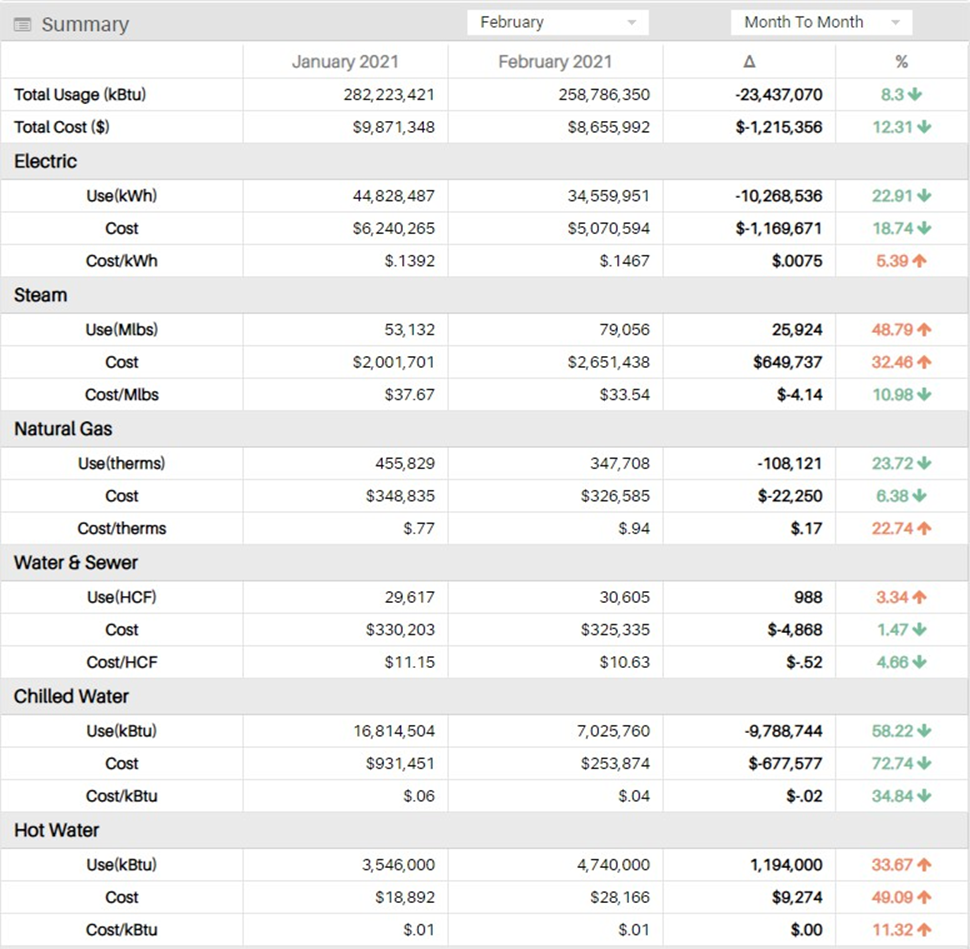
When you reach the Invoice Management landing page, there will be a cost graph and a summary chart showing data from your entire portfolio.
COST ($) GRAPH
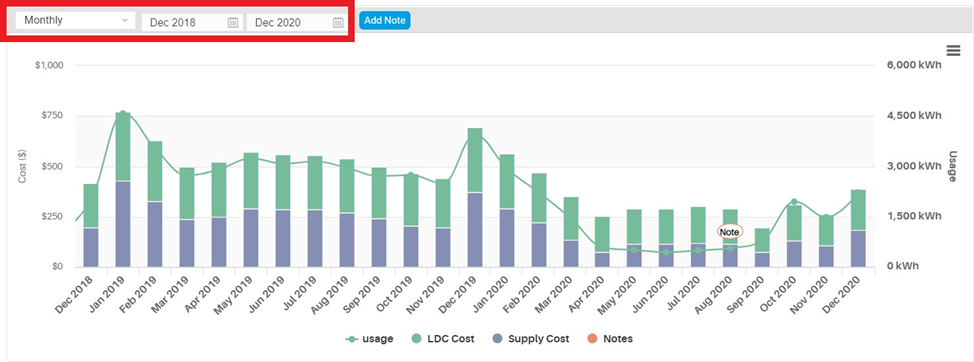
The cost graph on the Invoice Management landing page shows a summary of spend by commodity (e.g., natural gas, water & sewer, electric, fuel oil, steam) for the entire portfolio or group. The time frame can be updated at the top left of the graph to show data for different periods. Energy units are normalized to a universal unit basis to show usage across different seasons and facilities.
SUMMARY CHART
The summary chart provides an overview of monthly spend and unit rates, compared against set time criteria. The chart shows the change in volume, costs, along with the % difference.
Same as above, the time period can be updated in the top right corner of the chart.
PROPERTY ANALYTICS
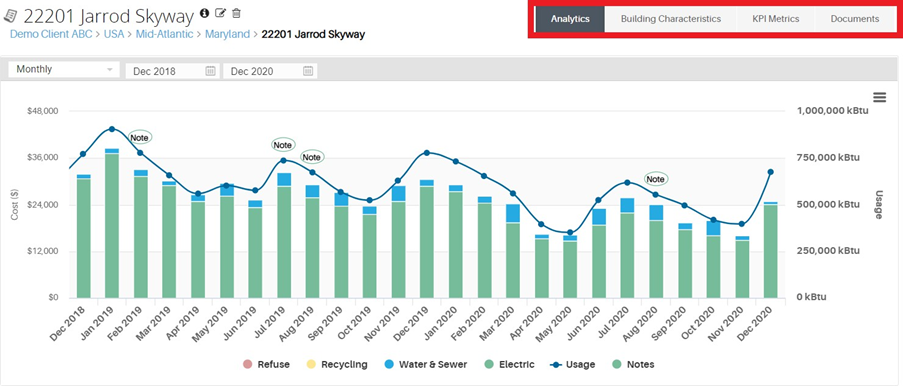
For the property view, there are 4 tabs at the top: Analytics, Building Characteristics, KPI Metrics, and Documents.
ANALYTICS
The analytics tab shows a Cost ($) Graph and Summary Chart, similar to the portfolio view (above) but for an individual property. In the hierarchy navigation bar on the left hand side, each commodity account will be listed below the property name. First, click down until you reach the electricity account. In the Analytics tab, you will find a summary of costs per kWh by supply/delivery and usage as determined by set time frame (time frame can be updated at the top left of the chart). There is also a detailed summary of the costs as determined by the set time frame (time frame can be updated at the top right of the section).
For markets with capacity or transmission components, there will be an additional demand summary.
For the demand summary:
Peak demand – max demand for the calendar year
Load factor – a measurement of how efficiently the property is using electricity
ICAP/PLC Tags – capacity tags for current and historical years
INVOICE TAB
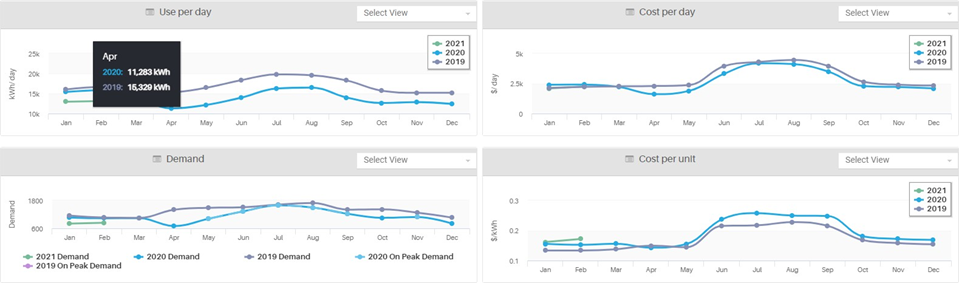
Clicking on the Invoice tab next, you will see 4 charts that show: Use per day, Cost per day, Demand by year, and Cost per unit. The charts can be shown in line graphs or bar charts.
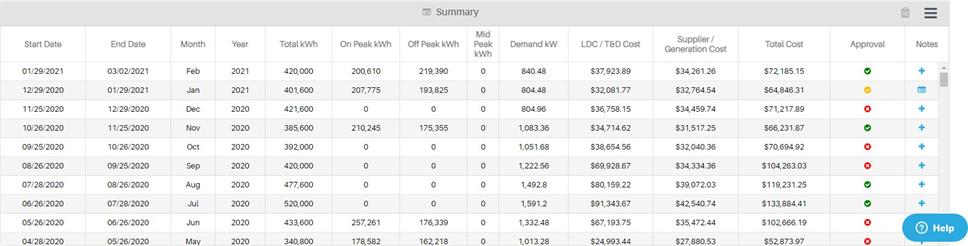
The summary features a month by month breakdown of costs, usage, demand and audit approval. You also have the ability to add any additional notes to explain the invoices by clicking the + symbol.
REVIEWING INVOICES
To review an invoice, click on the invoice month to review – both supply and delivery will be available for viewing. To go between supply and delivery, click on the LDC/Supply box on the right-hand side.
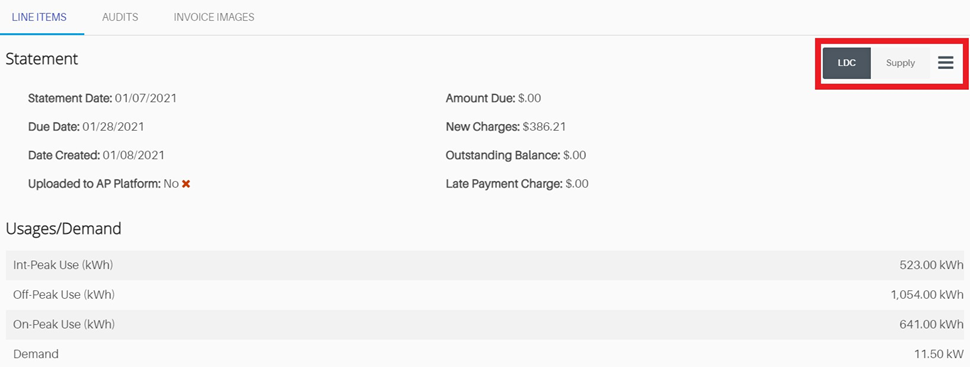
The three sections to review your invoices are:
Line Items: This section shows all charges for the selected billing cycle itemized.
Audits: The system automatically audits each invoice when processed, and will determine if the invoice passes the variances. Audits for both Delivery and Supply can be verified, just toggle between the two on the upper right-hand side.
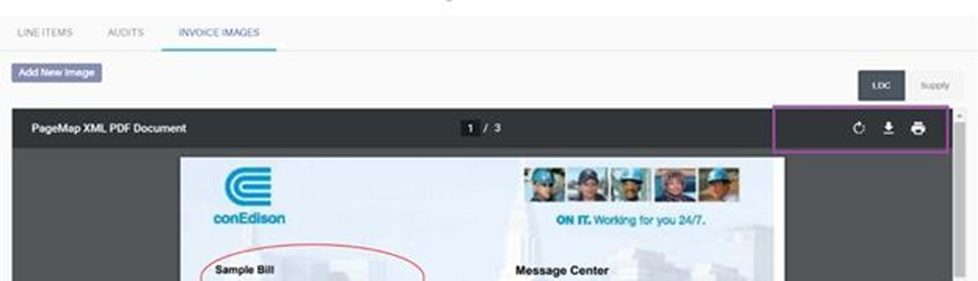
Invoice Image: This will display a PDF of the supply or utility invoice for the selected billing period. Invoices can be downloaded or printed by hovering to the top of the invoice image until icons appear on the right side.
PROPERTY CHARACTERISTICS
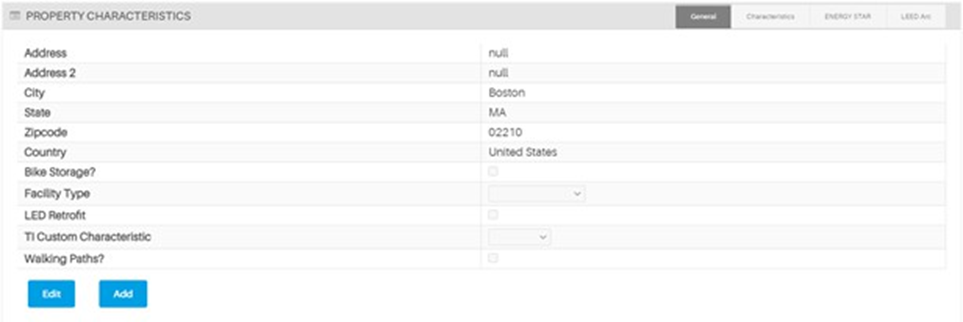
On the top right corner while in Property View, click on the Property Characteristics tab. The different sections seen are:
General: Specific information regarding the property is listed. The attributes can be edited or added by clicking the two blue buttons underneath the data.
Account Characteristics: This section lists more property characteristics. You can add characteristics with the blue button.
ENERGYSTAR: To sync with your ENERGYSTAR account, enter your Portfolio Manager ID. Click Yes to allow daily syncing with ENERGYSTAR Portfolio Manager and Yes to allow WatchWire to update property settings in ESPM.
LEED Arc: You must connect to arcskoru.com first, then follow the steps listed to authorize.
KPI METRICS
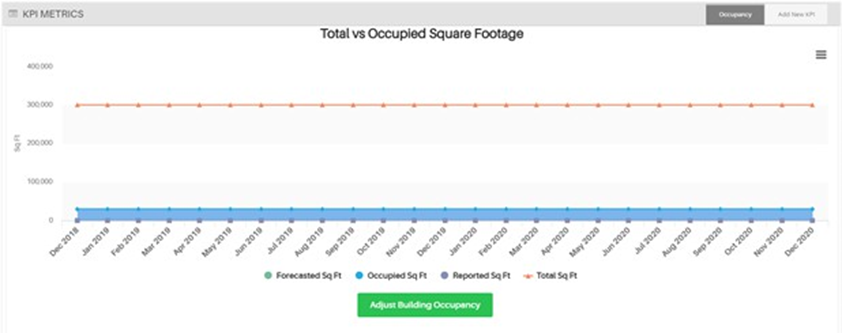
On the top right corner while in Property View, click on KPI Metrics tab. Here you will find a set of predefined metrics available to view. Click on the hamburger menu to the right to download the image of the graph.
CREATING NEW KPI METRICS
To add a new KPI, click on the upper right tab of the chart. Enter in the name, description, unit, and aggregation method.
DOCUMENTS
WatchWire allows you to upload, track, and view any of your documents. Documents may be uploaded and can be downloaded or viewed as PDFs.
Was this article helpful?
That’s Great!
Thank you for your feedback
Sorry! We couldn't be helpful
Thank you for your feedback
Feedback sent
We appreciate your effort and will try to fix the article