SEARCH
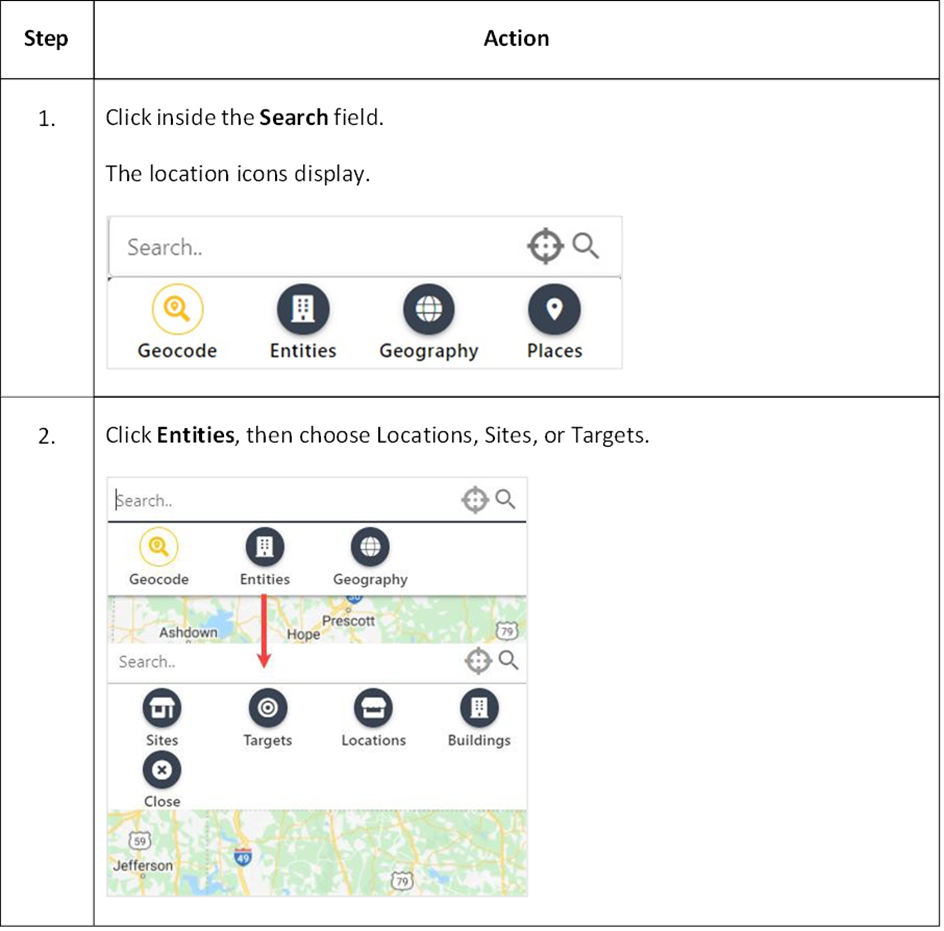
The user can lookup existing entities such as Targets, Sites, Prospects, and Locations either by Address, Existing Record, or Lat/Long coordinates.
Note: Geocode searches require a valid latitude and longitude.
LOCATE AN ADDRESS
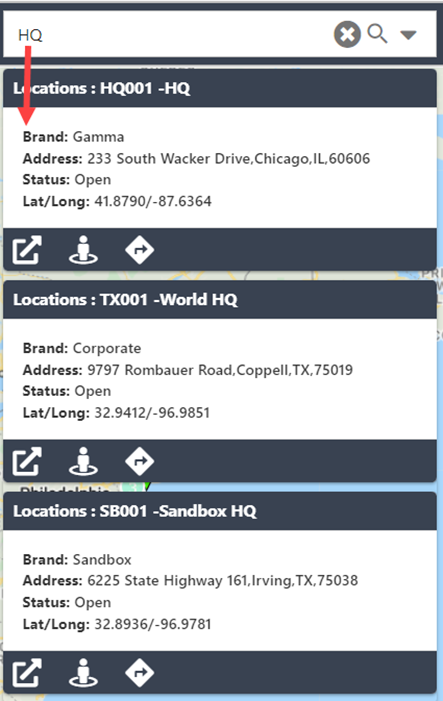
This example is using the Locations icon and key word HQ.
3. Click Locations, then type HQ in the search field and press Enter.
A list of results display
4.
|
Perform the following on the result:
Note: Hover over each icon to reveal their function.
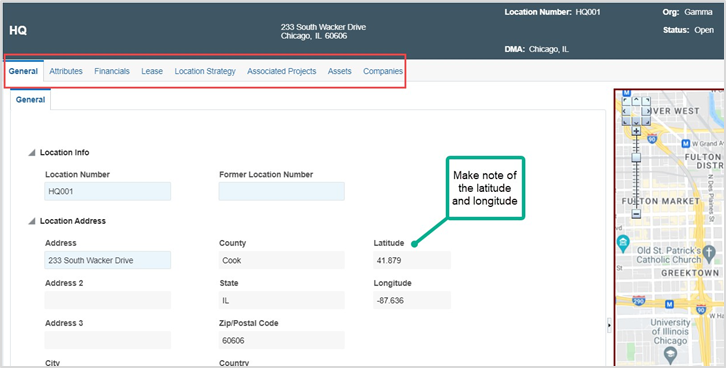
Click Info.

A detailed page displays for the address, including all lease information, assets, etc.
Click Street View.

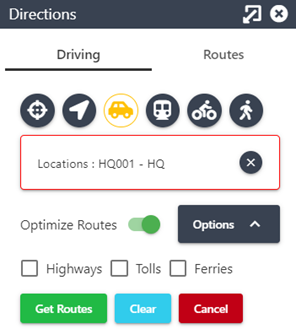
A street view displays, if available. Click Navigate.

A menu displays with options to navigate to the location.
|
Step
|
Action
|
|
|
|
|
Click Sales Forecasting.
Note: If searching for a site, click the Sales Forecast icon and refer to the Sales Forecast procedure.
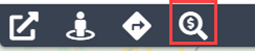
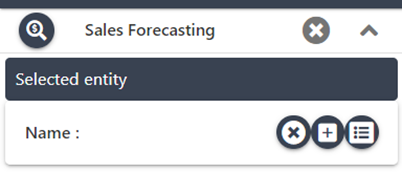
A Sales Forecast pop-up displays on the left pane.
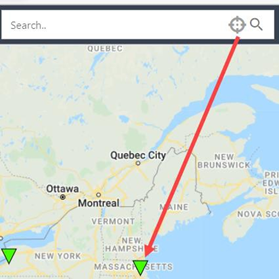
Optional: Click the Pick icon, then click a desired location on the map. The coordinates display.
|
The Navigation Menu is located on the right side of the Search pane and is viewed by clicking the vertical ellipsis.
Note: Hover over each icon to reveal the name.
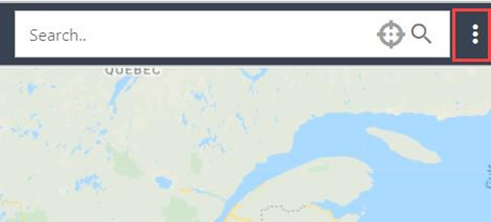
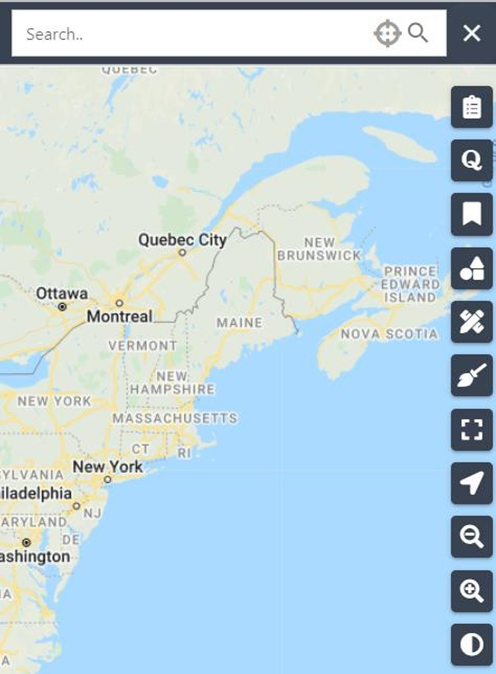
The table below describes the features of the Navigation menu.
Icon
|
Feature/Description
|
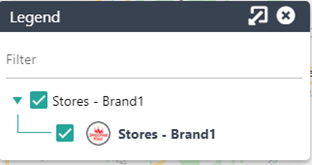
Legend

|
Displays the map legend.
Uncheck a layer to turn the layer off
|
Map Query Builder

|
Map Query Builder (QB) tool assists in locating Sites, Targets or Locations based on the filtering criterion.
Displays icons on the map to view, for example, locations greater than 4,000 square feet Query based on Trade Area Demographics
|
Bookmark

|
Bookmark Tool saves the current location, zoom level, and layers selected.
|
Annotation

|
Create temporary annotations on the map.
|
Get Distance

|
Calculates the distance between two or more points.
|
Clear Layers

|
Clear any turned on layers
|
Full Extent

|
Reset view of map to user's country.
|
Icon
|
Feature/Description
|
My Location

|
Locates current user based on IP address. This feature is useful for in field or on site visits.
|
Zoom In/Zoom Out

|
User can focus on specific areas.
|
Dark Mode

|
Darkens the screen without degrading features.
|
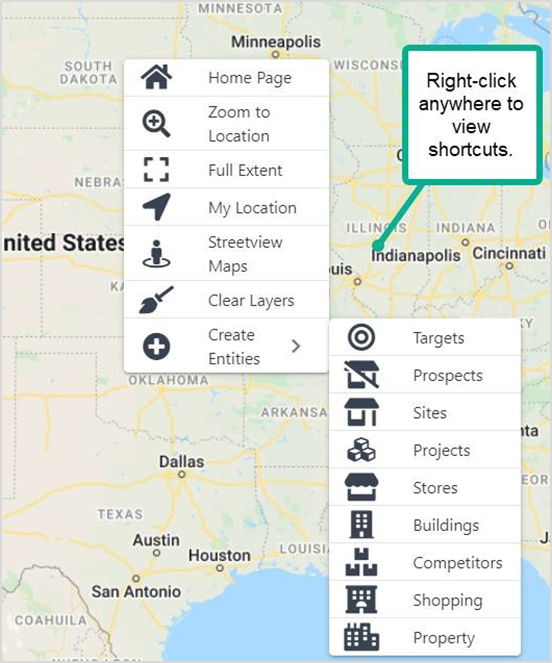
TIP: Right-click anywhere on the Map to reveal shortcuts to features and functions.
This section provides step by step procedures for some of the navigation icons.
Step
|
Action
|
1.
|
Get Distance:
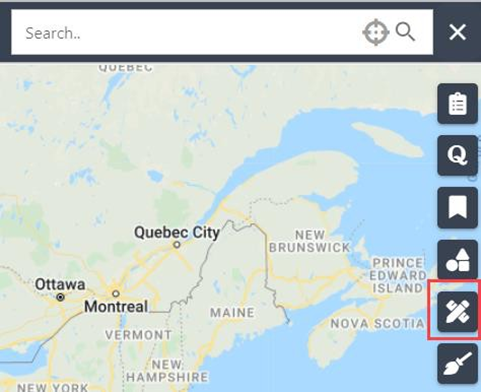
Click Distance Tool.
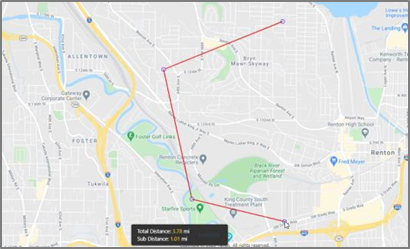
Click two or more points on the map.
The distance between the points displays as miles.
Note: The Sub-Distance measurement represents the last two points selected.
Click the last selection to stop the tool. Click Get Distance to clear the map.
|
2.
|
Annotate the Map:
Click Annotation.
Note: This feature is temporary and does not save between sessions.
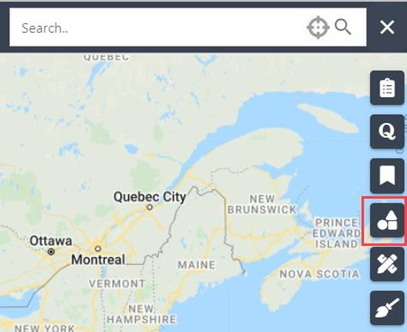
The Annotation menu displays. Select a shape, then choose a fill and line color. Click Apply Style.

-
Drag the mouse over the desired area. The applied shape displays.
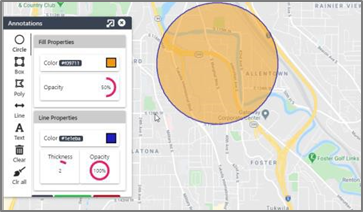
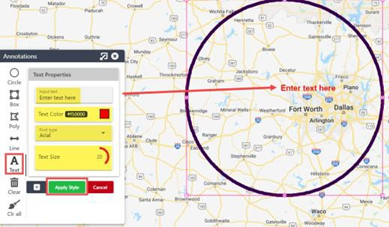
Click a point in the shape for text, then click Text. Enter text in the field, choose a color, size, and font, then click Apply Style. The text displays in the shape.
|
Step
|
Action |
|
|
|
|
h. Click Annotation to remove the shape and text.
|
3.
|
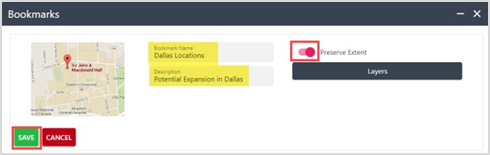
Create a bookmark:
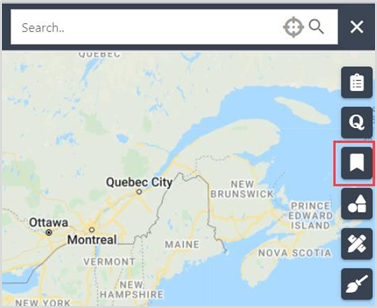
Choose a location, zoom level, layers (e.g., competitors) on the map, then click Bookmark.
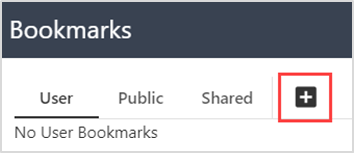
Click +, then complete the Bookmark Name and Description fields.
Optional: Slide Preserve Extent bar to on.
Note: This feature, when enabled will take user to the location bookmarked, else if not selected the bookmark turns on layers wherever user is on the map.
Click Save.
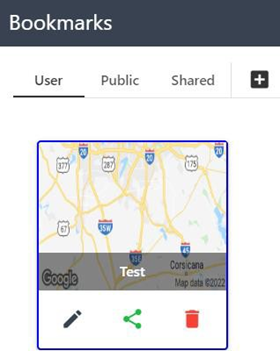
Re-click Bookmark.
The saved bookmark displays.
|
Step Action
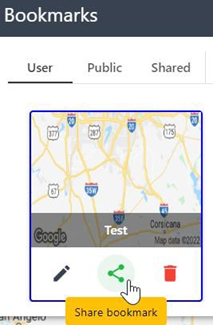
Optional: Click Share.
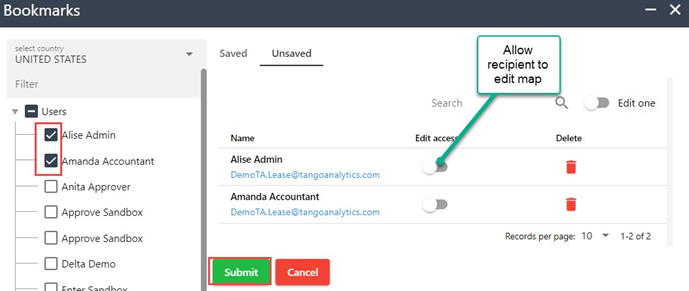
Click the box next to user(s).
Slide the bar Edit Access to on, as applicable.
Click Submit.
4.
|
Create a Query:
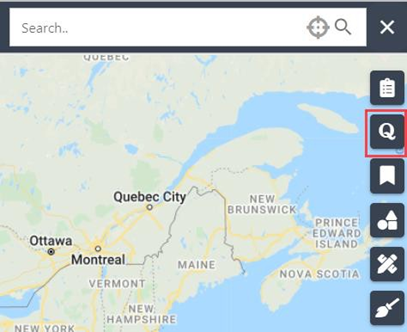
Click Query Builder.
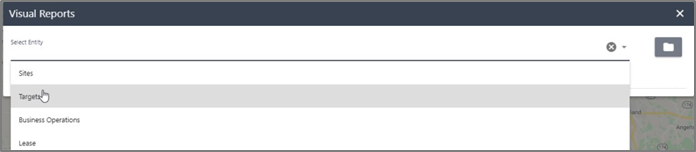
Select an entity in the Select Entity drop-down.
Note: Choices may differ from depiction below.
Select a country in Country drop-down.
Note: Defaults to user's location.
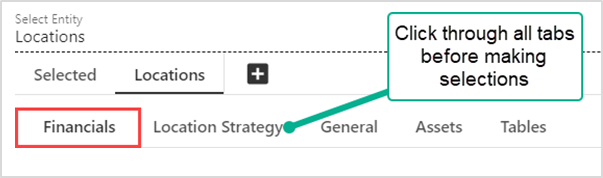
Build the query by selecting attributes.
TIP: Click on all tabs to understand filters. Some tabs may have same or similar attribute names.
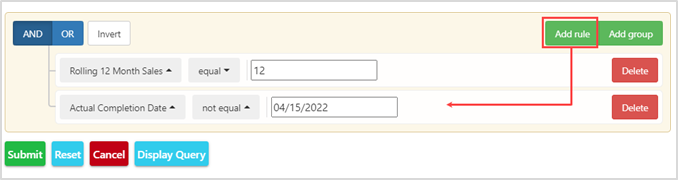
Create a Boolean search, and click Add Rule to create new rows, as applicable.
|
Step
|
Action
|
|
Click Submit. The results display. -
Click one of the following Output choices:
View on Map – Minimize Output pop-up to view map results. Table –Click ESC to hide table. Excel – Downloads to desktop. Edit – Make changes. Clear – Erase the query. Cancel – Begins the process again. Save As Enter a name for your query.
|
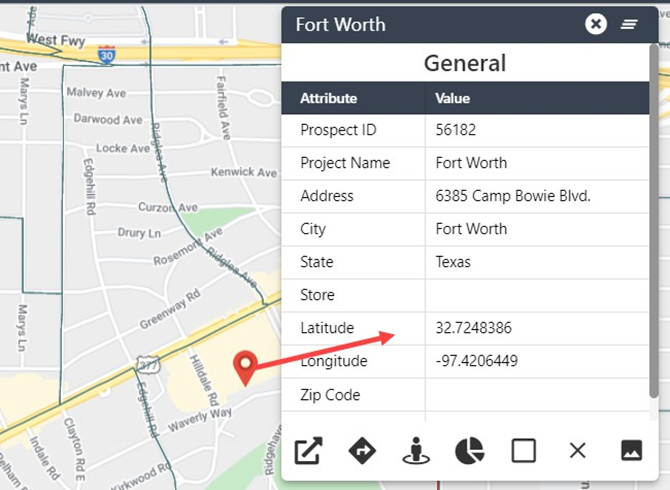
When a Target, Site, Location, Shopping Center, Competitor icon, and Territory is selected on the Map, a window displays additional information. Other information can be found in the icons at the bottom of the window. See table below for a description of each.
Note: Not all users will see all information windows.
Icon
|
Definition
|

|
Entity Record when all data is visible.
|

|
Directions via Google Maps.
|

|
Street View via Google Maps.
|

|
Demographic charts for the selected entity.
|

|
Trade area for Locations, Sites, and Targets.
|

|
Turns Trade Area display to off.
|

|
Opens any photos associated with the selected entity.
|

|
Turns the Location Customer dots, if applicable.
|
DRAG AND DROP
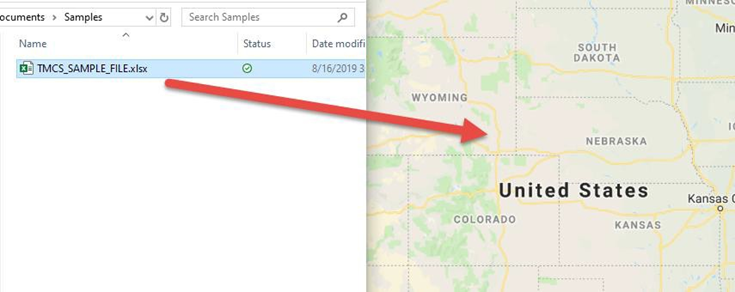
The Drag and Drop feature enable users to drag an Excel or CSV file onto the map to analyze or present data. The data can be a point on the map or a polygon.
Requirements:
Format: Excel, Comma-separated Value (CSV) file, or Keyhole Markup Language (KML)
Columns with titles and values Latitude and Longitude Formatting best practices:
Start the file with a column named ID, etc. rather than Number.
No special characters in the column header name
Max column count: 40
For Excel: Max 10,000 rows
-
Polygon acceptable formats:
Step
|
Action
|
1.
|
Select the file from the local drive and drag onto the map.
|
Step
|
Action
|
2.
|
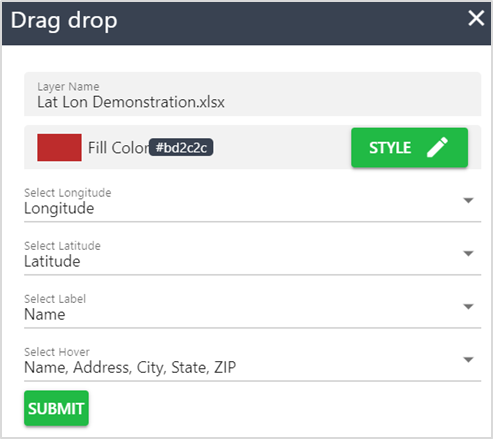
Complete the dialog box as follows:
Note: The dropped file is analyzed, and fields auto-populate. Changes can be made to the column names in the Drag drop pop-up.
Choose Select Longitude drop-down, as applicable. Choose Select Latitude drop-down, as applicable. Choose a Selected Label Column in the drop-down - The column that displays next to the icon on the map, e.g., Name, ID, etc. Choose columns to view in hover mode in Hover Variable(s) drop-down.
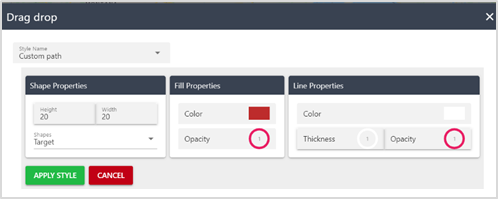
Click Style and select Shape, Fill and Line Properties, then click Apply Style.
Click Submit.
The file displays as a User-defined Layer.
|
3.
|
|
Click Layer Control in the Layer Control Ribbon.

The Layer pop-up displays.
Locate the User-Defined Layer.
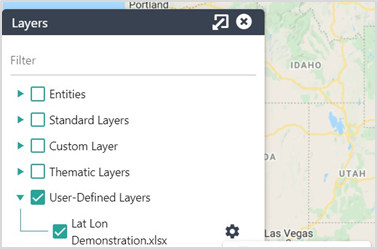
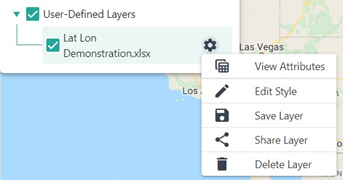
Click the Gear icon and choose one of the following:
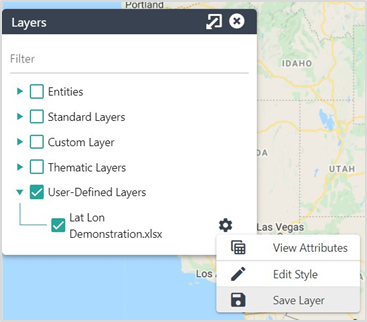
View Attributes: Displays the file in a new pane.

Edit Style: Perform Step 2.e. to change appearance. Save Layer: Save, Share or Delete the layer.
|
LAYER CONTROL RIBBON
This section describes how to access maps and layers.
Step
|
Action
|
1.
|
Click Maps in the Layer Control ribbon.
|
2.
|
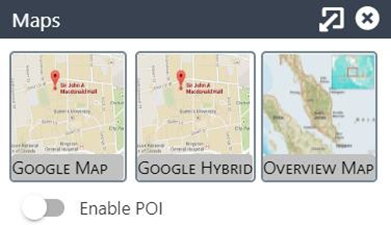
Click to view Google Maps.
Optional: Click slide bar Enable Points of Interest (POI).
|
Step Action
-
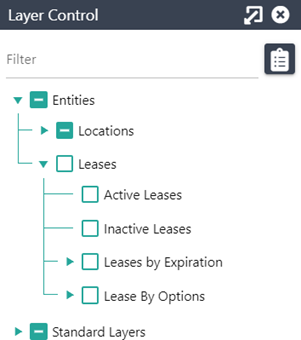
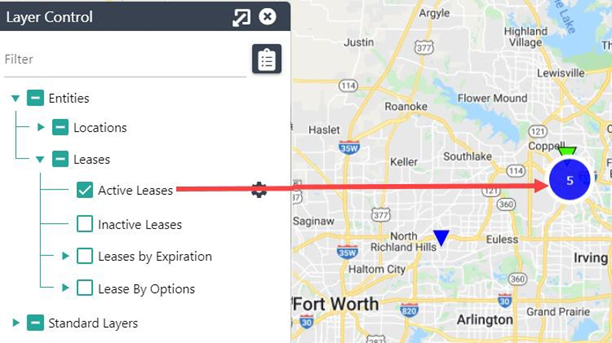
a. Click Layers.
Select an Entity and/or Standard Layers, as applicable.
Click to zoom in, if prompted, else click on the number (cluster of results) to zoom in and view.
THEMATIC MAPS RIBBON
A thematic map displays the geographic pattern (demographics) of a particular area. This section describes how to add variables to maps.
Step
|
Action |
1.
|
Zoom into an area of interest on the map.
|
2.
|
Click Standard in the Thematic Maps ribbon.
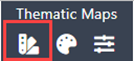
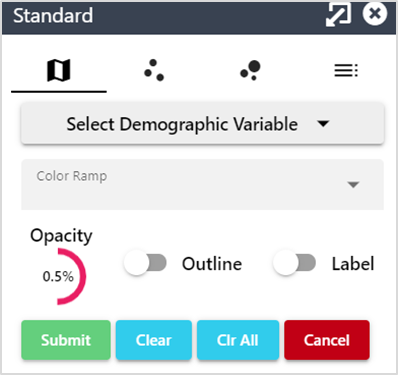
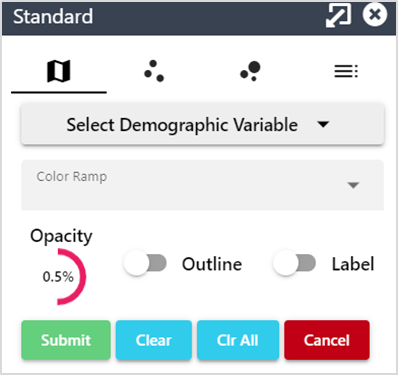
The Standard menu displays.
|
3.
|
Select the values as follows:
Choose a filter in the Demographic Variable drop-down.
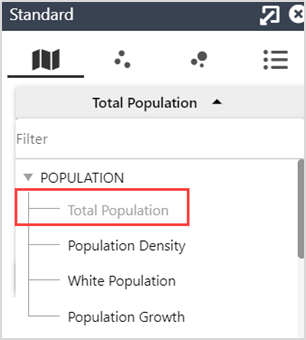
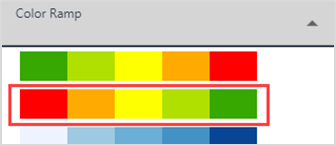
Choose a color range in the Color Ramp drop-down.
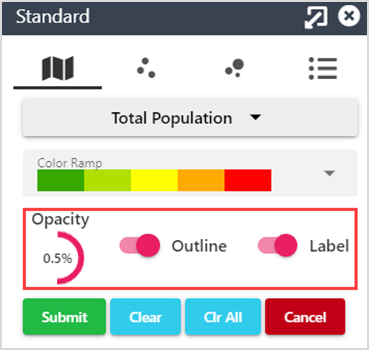
Choose Opacity, Outline, and Label, as applicable, then click Submit.
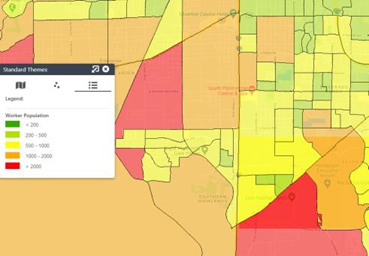
The results display.
|
Step
|
Action |
4.
|
Click Clear to remove layers or click Cancel to close.

|
5.
|
Click Standard.
The Standard menu displays.
|
Step
|
Action |
6.
|
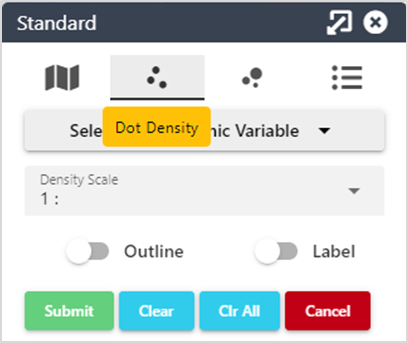
Click Dot Density.
|
7.
|
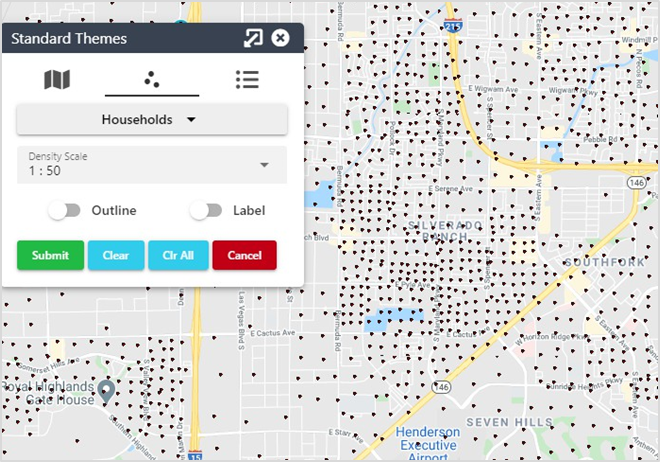
Choose a value in the Select Demographic Variable drop-down.
Note: Dots are in addition to the thematic map; however, in this case the labels overlap the thematic variable. A single dot represents 50 households.
Slide the bar on Outline or Label, as applicable. Click Submit. The results display.
|
Step
|
Action |
8.
|
Click to perform one of the following:
Note: Click Clear All, then Cancel to completely clear and exit.
Clear - Remove the current layer (in this example, the dots would disappear) Clear All - Remove ALL layers but leave the Thematic mapping active. Cancel - Close the Thematic map pop-up but leave the thematic exposed (example: if you wanted to print the map).

|
9.
|
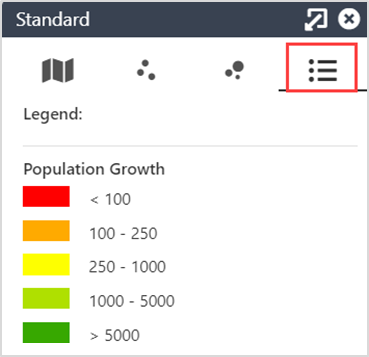
Click Legend and view the ranges for the criteria selected (i.e., population growth).
|
10.
|
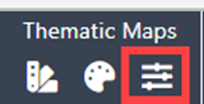
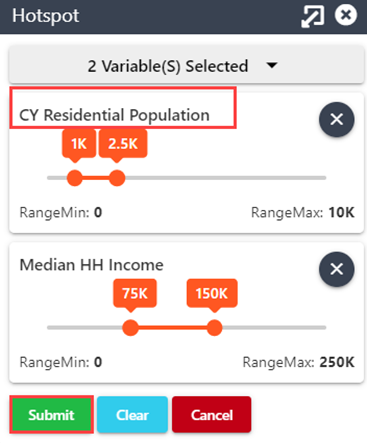
Click Hotspot.
Note: The hotspot should be chosen when a list of specific variables is needed.
|
Step
|
Action |
11.
|
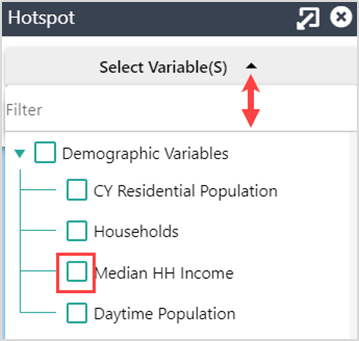
Click the down caret on the Select Variables drop-down, then check the box next to the variable(s).
Note: More than one variable can be chosen from the list.
|
| 12. |
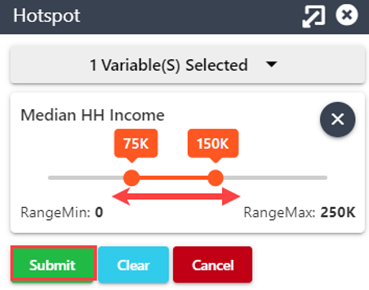
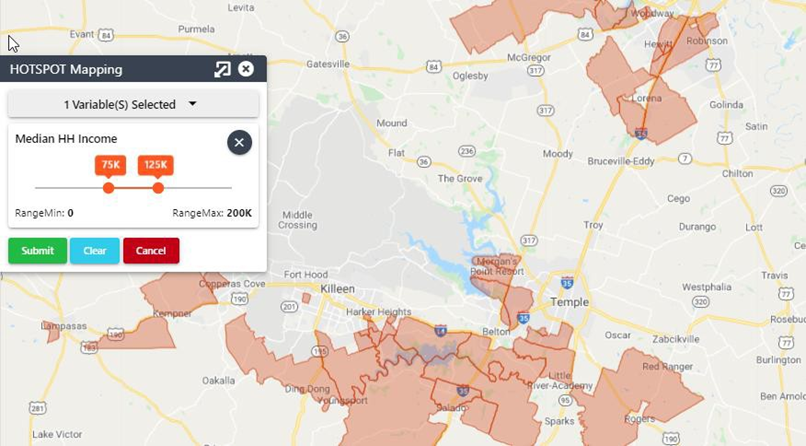
Modify the variable range (i.e, income), if applicable, then Submit.
The results display on the map
|
| 13. |
Optional: Check the box for another variable, then click Submit.
|
| 14. |
Click Clear, else click Cancel to close.
|
MANAGE ENTITIES RIBBON
This section describes the procedures to create new entities and manage existing trade areas.
CREATE TARGETS
Targets are an area where a Site will be created, not the Site itself.
IMPORTANT: Creating a target is a prerequisite to creating a Site.
Step
|
Action
|
1.
|
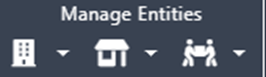
Click Create Entity in the Manage Entities ribbon.
|
Step
|
Action
|
2.
|
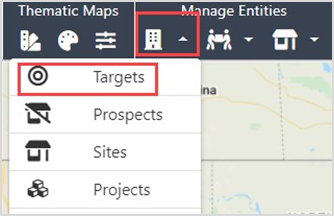
Click Targets in the Create Entity drop-down.
|
3.
|
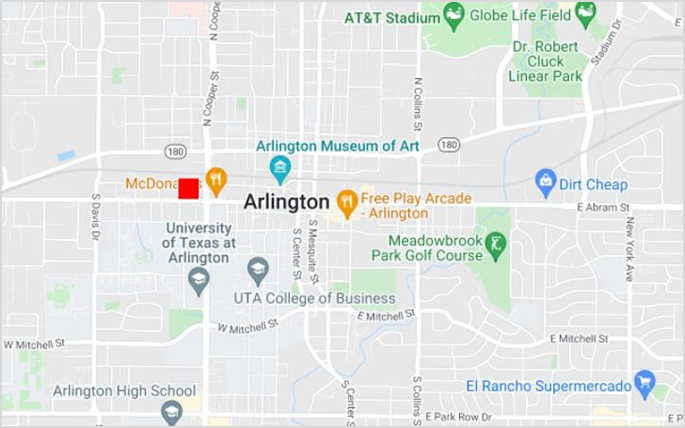
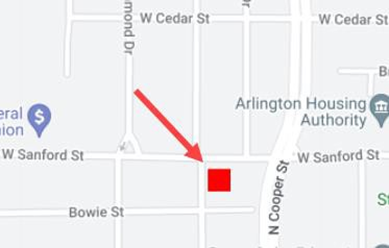
Click a spot on the map to create the target.
Best Practice: Do not put the target on top of the Site location (e.g., in the center of an intersection, where the Site will be on/near one of the corners.)
The target is zoomed.
|
Step Action
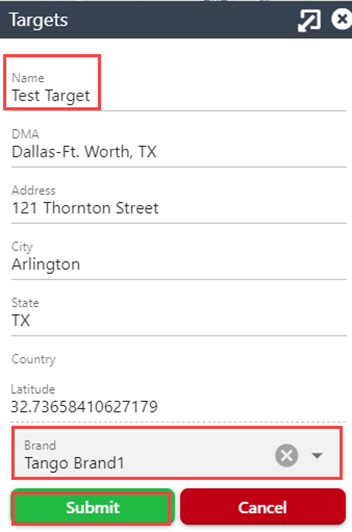
Complete the target pop-up as follows:
Type a Target name in the Name field.
Scroll to the bottom and choose a Brand in the drop-down.
-
Click Submit.
The Target icon displays on the map.
CREATE SITES
Step
|
Action
|
1.
|
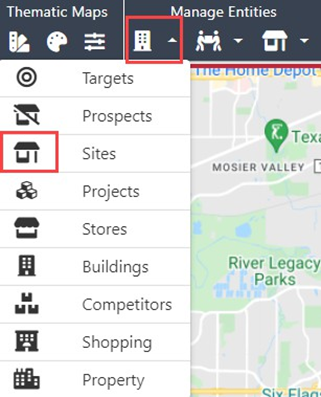
Click Create Entity in the Manage Entities ribbon.
|
2.
|
Click Sites in the Create Entity drop-down.
|
3.
|
Click the site location on the map.
Note: The site must be created within a target trade area.
Best Practice: Multiple Sites can be linked to the same Target so zoom in to ensure Site is in correct location.
|
| 4. |
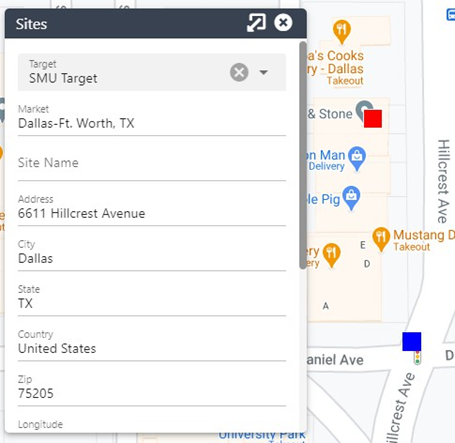
Complete the Site pop-up and update any fields, as applicable, and then click Submit
A new site is created.
|
CREATE COMPETITORS
IMPORTANT: Creating Competitors is not recommended if user organization is configured with Chain XY competitor data. Chain XY is a third-party data provider that searches and updates locations, such as competitors, monthly. Creating user competitors may result in duplicate entries.
Step
|
Action
|
1.
|
Click Create Entity in the Manage Entities ribbon.
|
2.
|
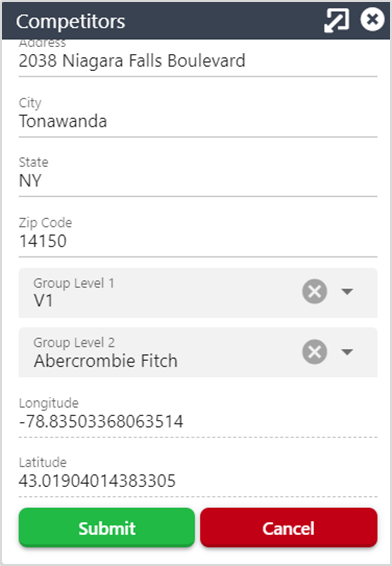
Click Competitors, then click on map where the competitor will be created. Type the store name in the Name field will appear as the Store Name. Click Submit.
The Group will define how it is displayed on the map and used by the sales forecast model.
|
MOVE ENTITIES
This function allows authorized users to move a Target, Site, or Store on the map. This procedure is used when an entity was not placed on the exact location.
Note: Use care not to move entity outside of Target Trade Area.
Step
|
Action
|
1.
|
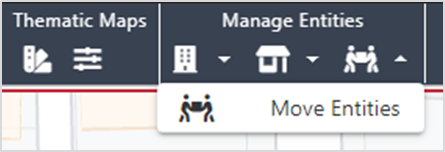
Click Move Entity in the Manage Entities ribbon.
|
2.
|
Select the entity to move.
|
3.
|
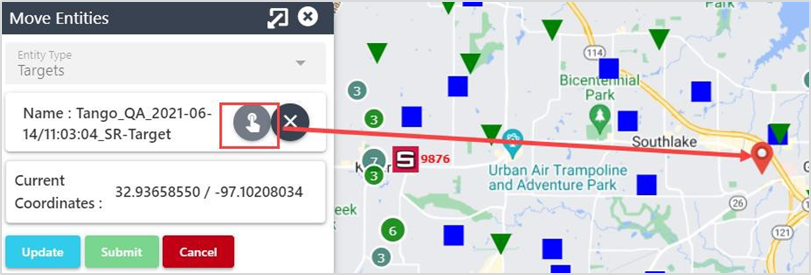
Click the pointer, then click the entity. The entity name displays on the form.
|
4.
|
Click the entity icon.
|
5.
|
Drag the icon to the new spot.
|
Step
|
Action
|
6.
|
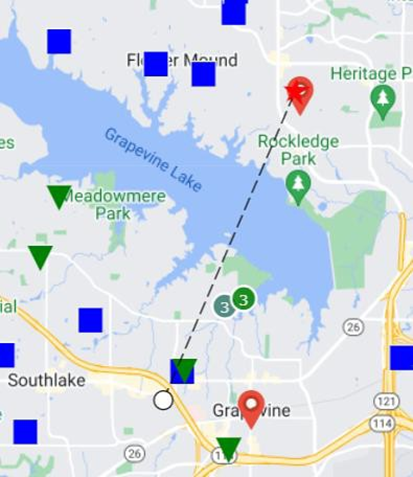
Click Update.
A dashed line displays between the two points.
|
7.
|
Click Submit.
The move is sent for Approval.
|
APPROVE MOVES
The Move Admin User role will receive an email that a user has submitted a move for approval.
Note: This procedure is for Admin roles. Non-admin roles can proceed to next section.
Step
|
Action
|
| 1. |
Navigate to Functional Dashboard and click on Move Entity int he My Alerts tab.
|
|
|
| 2. |
Click Search in Move Entity pane.
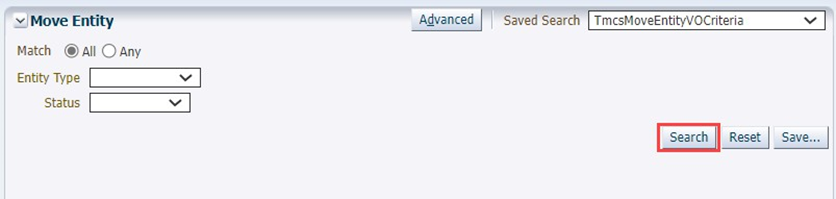 A list of entities displays.
|
|
|
3.
|
Click to highlight the row, then check the box Approve or Reject.
|
| If |
Then |
Approved
|
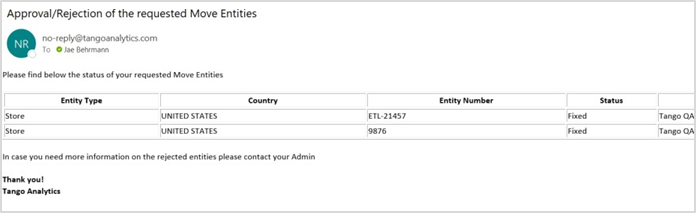
The coordinates of the entity are changed, and a confirmation email is sent to requestor.
|
Rejected
|
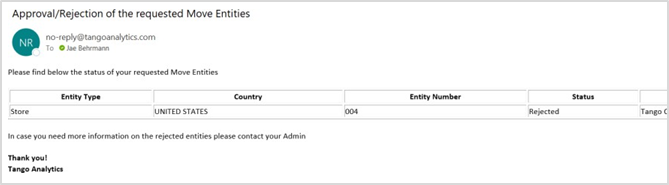
The request is cancelled, and a confirmation email is sent to requestor.
|
TRADE AREAS
EDIT SITE TA
Use this feature when a change occurs based on local market knowledge.

Step
|
Action
|
| 1. |
Click Trade Area in the Manage Entities ribbon, then click Edit Site TA.
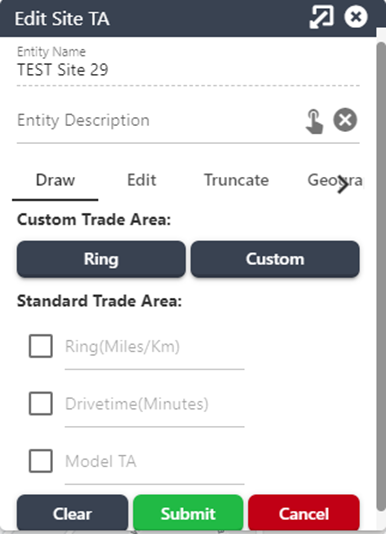
The Edit Site TA pop displays
|
| 2. |
Type the description of the new trade area.
|
3.
|
Click Draw then perform one of the following:
Ring Button
Click on the map where you want the center of the ring to be. Holding the left mouse button down drag the ring to the size you desire. A measurement will display as you drag the circle.
IMPORTANT: The circle must contain the Site.
Click Submit. Custom Button
The custom button allows you to create a polygon.
Click the map where you want to start the polygon and then continue to click on the map to draw the points. To complete the polygon, move the mouse to the first point created, the square point will change to a circle, click on the circle to complete the polygon. Click Submit.
|
Step
|
Action
|
4.
|
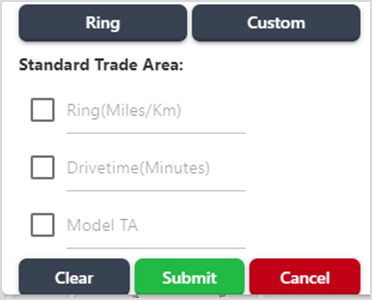
Navigate to the Standard Trade Areas and perform one of the following:
Ring
Check the Ring box and enter the size of the radius you want. Click Submit.
Drivetime
Check the Drivetime box and enter the minutes you want. Click Submit.
Model TA
Check this box to create a TA based on the model TA rules. Click Submit.
|
Step
|
Action
|
5.
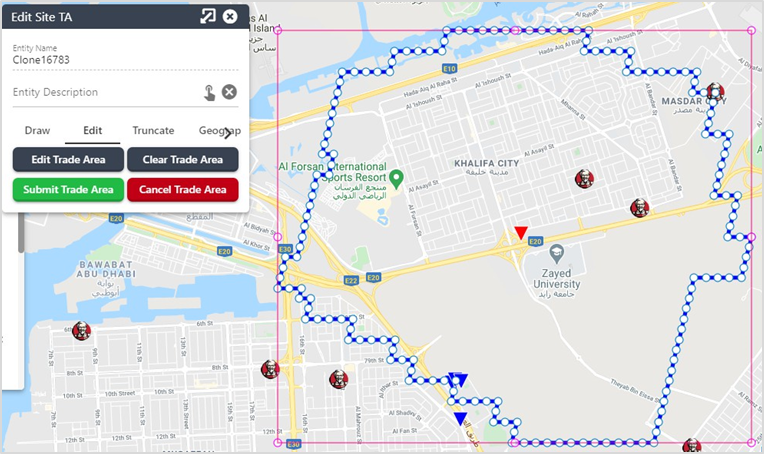
|
Click Edit to edit an existing trade area and perform the following:
a. Click Edit Trade Area.
b. Click on the Trade Area shape.
-
A blue line displays.
Click on an edge of the line to display the individual points. Click a point, hold down the left mouse, drag the point where you want to place it. Click on the Submit Trade Area to complete the edit.
|
6.
|
Edit a trade site using the Geography feature as follows:
IMPORTANT: This procedure assumes a Site has been created with an existing Trade Area.
Click Edit Site TA in the Manage Entities Ribbon.
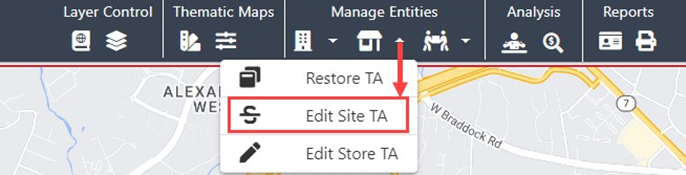
Select Site on the map. Enter a description in the Entity Description field. Click Geography.
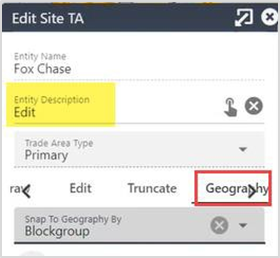
Choose Blockgroup in the Snap To Geography By drop-down.
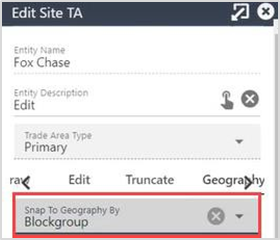
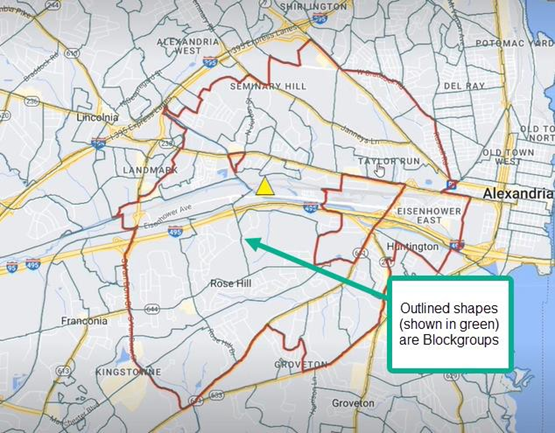
Note: The block groups, a US Census unit of geography, will draw on the map. This may take a few moments. Block groups are what form the edited Trade Area.
Other units of geography, such as census tracts, territories, zip codes, or Canadian dissemination areas, may also be configured to be used instead of block groups, but for this example, we will use block groups.
|
|
-
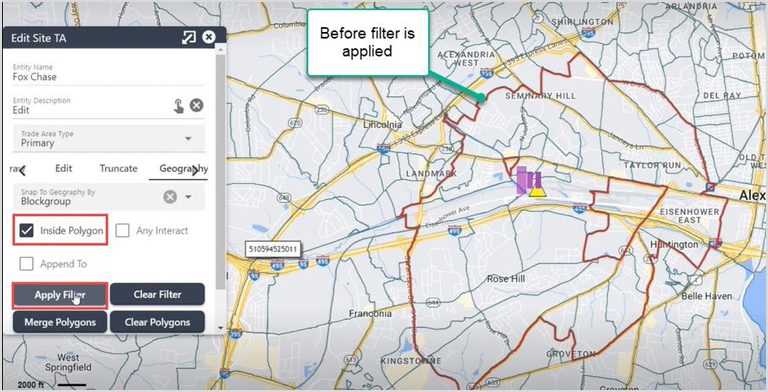
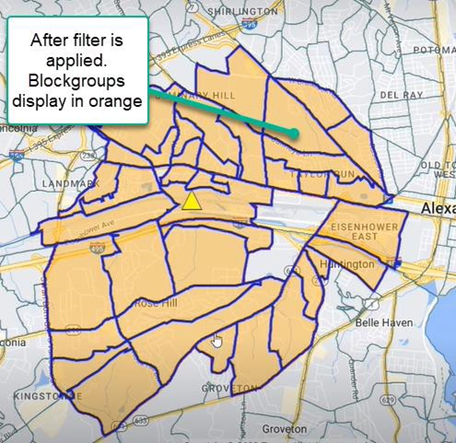
Choose from the following interactions, then click Apply Filter: In the example below, Inside Polygon filter was chosen.
Inside Polygon – Selects all blockgroups inside the existing trade area. Any Interact – Selects all blockgroups that touch the existing trade area. Append To – This interaction is useful when you need to add one or more geographies to the existing trade area. This interaction differs from the other two in that it will not show the geographies that already comprise the existing trade area but will only show those selected geographies to be appended to the existing trade area. Proceed to next step for detailed instructions on using Append To.
|
|
|
|
|
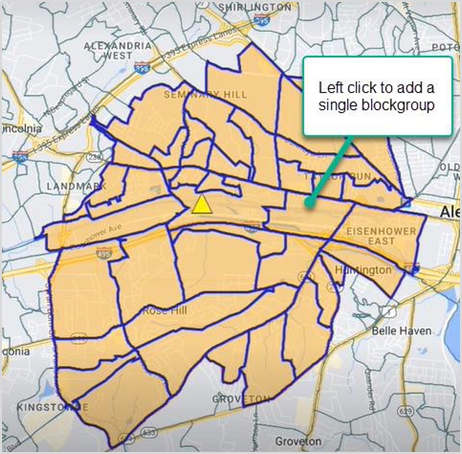
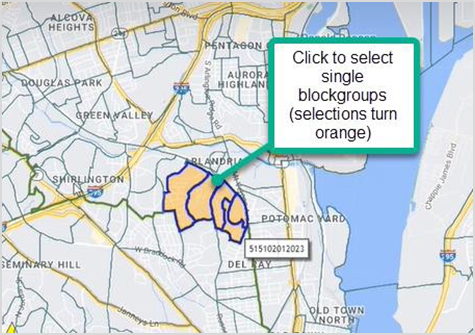
Left click mouse to select single blocks to add to Trade Area.
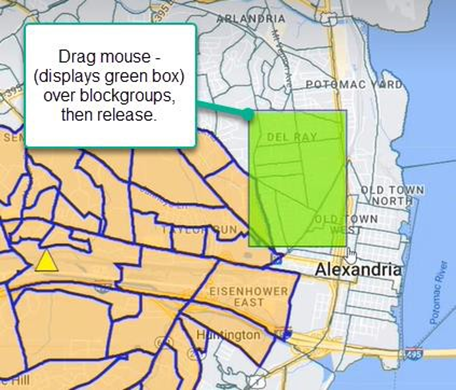
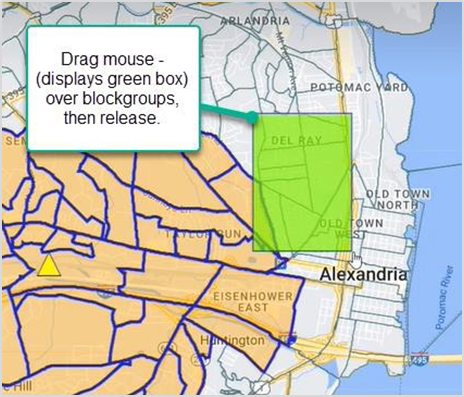
Press ctrl once, then release to activate the marquee feature and drag mouse to select blockgroups on the map, then release.
|
|---|
|
|
|
|
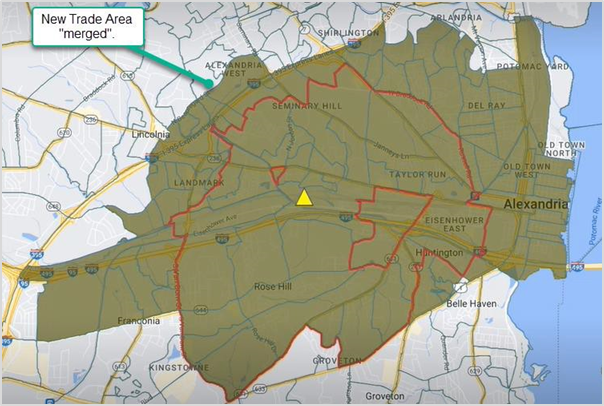
The additional blockgroups display in the Trade Area.
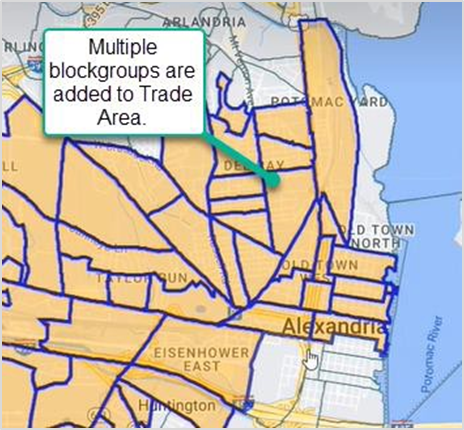
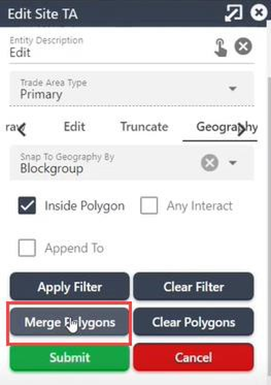
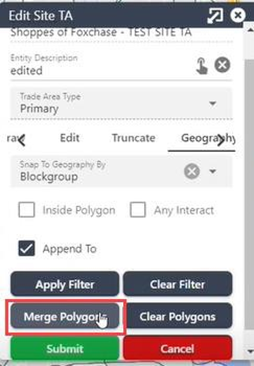
Deselect a blockgroup by clicking once on the group to remove from Trade Area, as applicable. Click Merge Polygons.
IMPORTANT: This step must be performed prior to Submit.
|
|---|
|
|
|
 |
k. Click Submit.
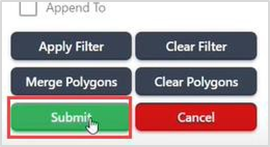
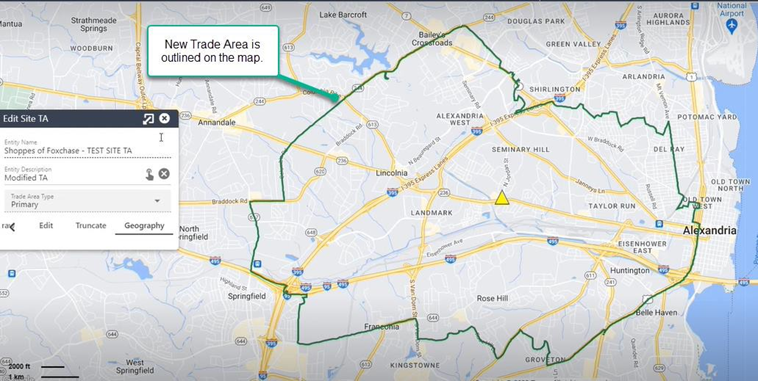
The new Trade Area is submitted to the database and a TA Created Successfully
pop-up will display at the bottom of the page.
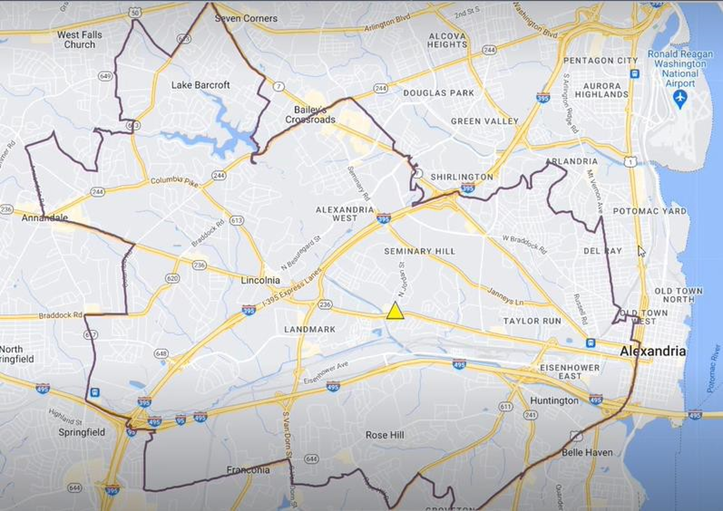
The new Trade Area displays is outlined on the map.
|
|---|
Step
|
Action
|
|
|
|
|
|
7.
|
Perform an Edit Site TA using the Append To feature:
Perform step 6 a- g. Select Append To filter, then Apply Filter.
Note: Nothing visually appears on the map. This is normal.
Click to select the blockgroups to append to the Trade Area.
Press ctrl once, then release to activate the marquee feature and drag mouse to select multiple blockgroups on the map, then release.
Click Merge Polygons.
|
|
|
|
|
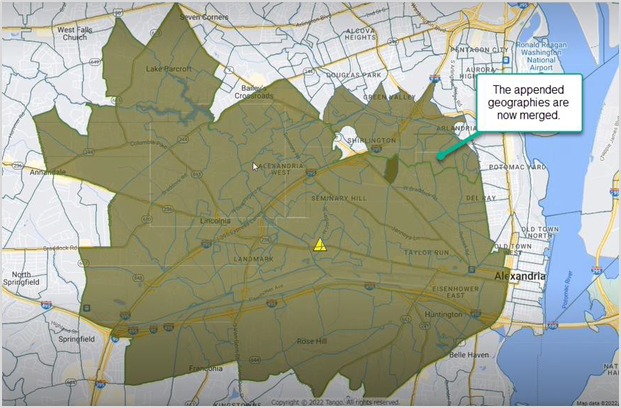
The selected geographies are appended (merged) to the existing Trade Area.
f. Click Submit.
The new Trade Area is submitted to the database and a TA Created Successfully
pop-up will display at the bottom of the page.
The new Trade Area displays is outlined on the map.
|
|---|
Step
|
Action
|
|
|
|
|
|
TRUNCATE TA
Note: This feature is not commonly used.
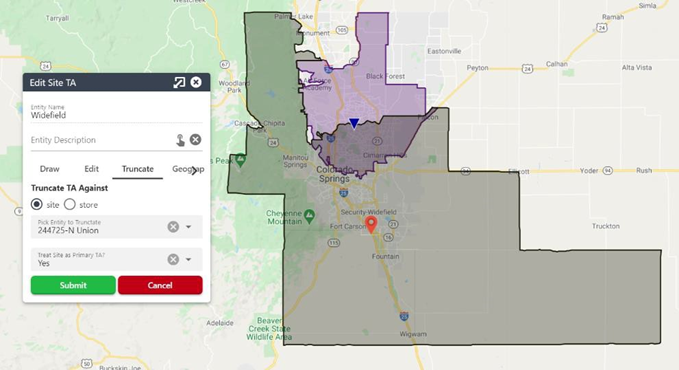
This option will use two Sites or a Site and a Store to keep the Trade Areas from overlapping.
Step
|
Action
|
1.
|
Select the entity, enter a description, and click Truncate.
|
2.
|
Click the radio button site or stores, as applicable.
A list of nearby sites or stores displays as a drop-down.
Select an entity to truncate from the drop-down.
|
3.
|
Choose Yes or No on the Selected Entity as Primary drop-down.
Note: Selecting Yes means change the TA of the Site originally selected. Selecting No means change the Site selected in the Pick Entity to Truncate.
|
4.
|
Click Submit.
|
RESTORE TA
Perform these steps to restore previously identified trade areas.
Step
|
Action
|
1.
|
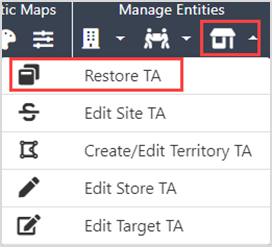
Click Restore TA in the Manage Entities ribbon.
|
2.
|
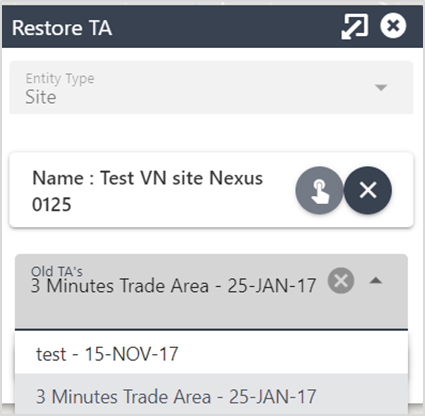
Choose Site in the Entity Type drop-down.
|
3.
|
Choose an old site in the Old TA's drop-down.
|
4.
|
Click Submit.
|
ANALYSIS RIBBON
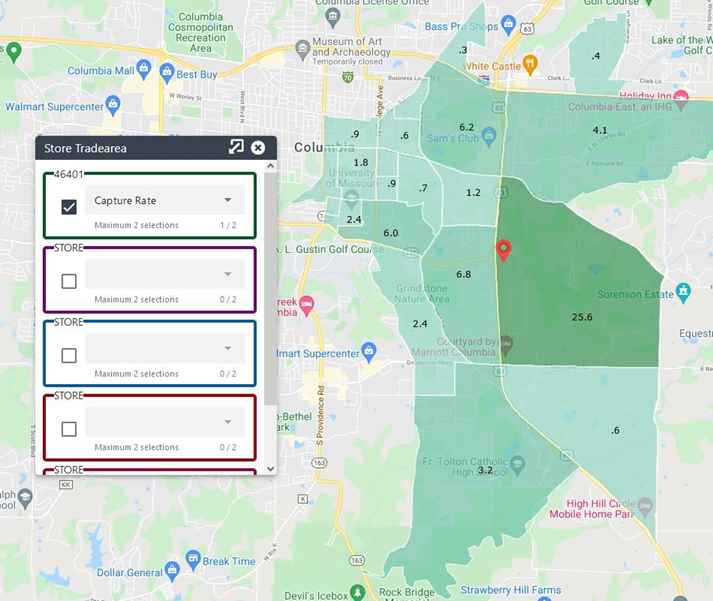
STORE TRADE AREA ANALYSIS
This tool has several layers of data, including:
Store Customers
Total Sales by block group
Note: A block group is a combination of census blocks and a subdivision of census tracts. They typically contain between 600 – 3000 people with an average make up of 40 census blocks.
Capture Rate by block group
Note: Refer to Appendix D – Definitions for terms used in this section.
TRAFFIC
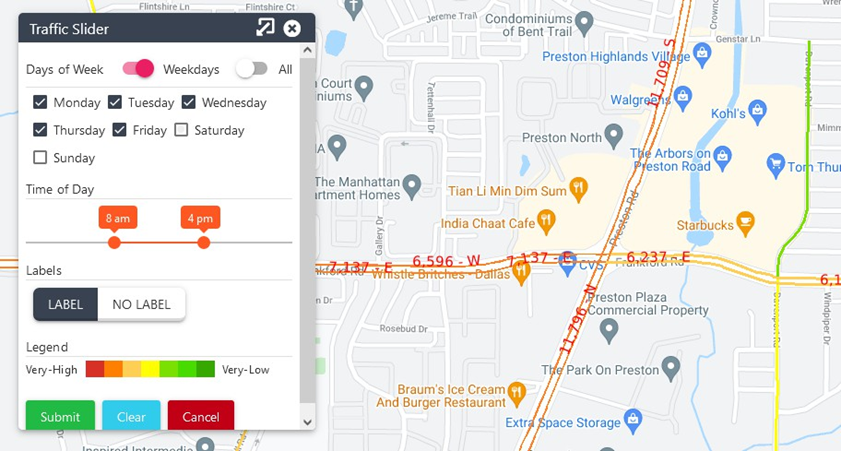
If Traffic data by Inrix is licensed, the Traffic Slider icon will be available. The Traffic Slider enables the user to select days of the week and hours of the day to see the volume of traffic.
RUNNING MARKET OPTIMIZATION FROM THE MAP
This section describes the steps to run Market Optimization.
Step
|
Action |
1.
|
Click Optimization in the Analysis ribbon.
The Store Optimization pop-up displays.
|
2.
|
|
Click + and complete the fields as follows:
Enter a Scenario Name. Enter a Description. Choose a brand in the Brand drop-down. Choose a type in the Optimization type drop-down. Choose a Designated Market Area (DMA) in the DMA drop-down. Click Submit.
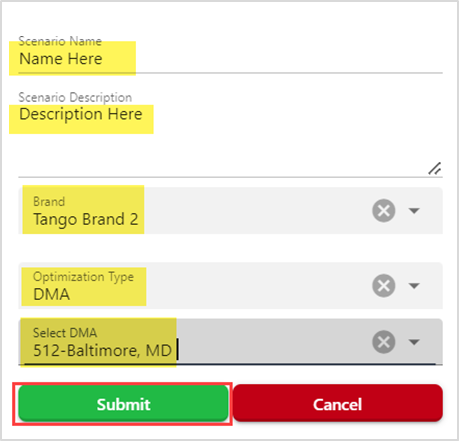
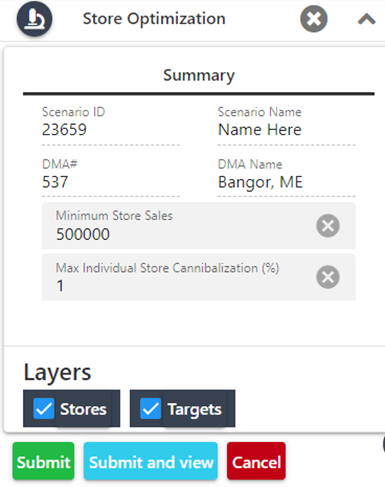
A summary pop-up displays.
|
|
|
|
|
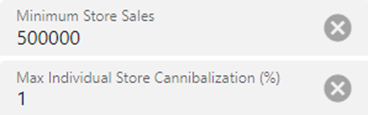
Enter a Minimum Store Sales as a numeric value. Enter a maximum individual store cannibalization percent as a numeric value, then click Submit.
A list of locations display.
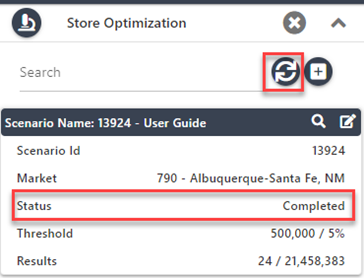
Click on the Stores button to list existing stores in the market. Select or deselect locations as desired. Click on the Targets button to list existing stores in the market. Select or deselect targets as desired. Click Submit. Click Refresh.
The status is set to Completed.
Click the magnifying glass to view scenario.
|
|---|
Step
|
Action |
|
The results display on the map as follows:
Green Circles – Optimization Points Purple Circles – Locations Orange Rectangles – Targets
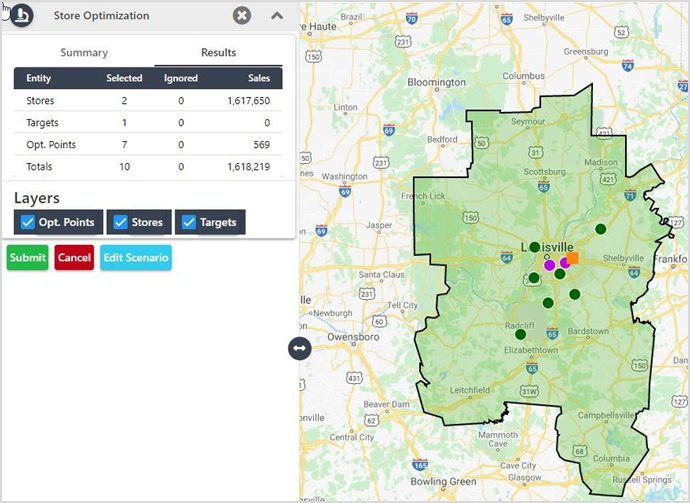
n. Click a point on the map to view the information window.
|
REPORTS RIBBON
CREATE DEMOGRAPHIC REPORT
Step
|
Action |
1.
|
Click Demographics Reports in the Reports ribbon.
|
2.
|
Choose one of the following to generate a report:
|
|
If…
|
Then…
|
|
Pick a Point
|
Click the radio button Point on the Reports tab.
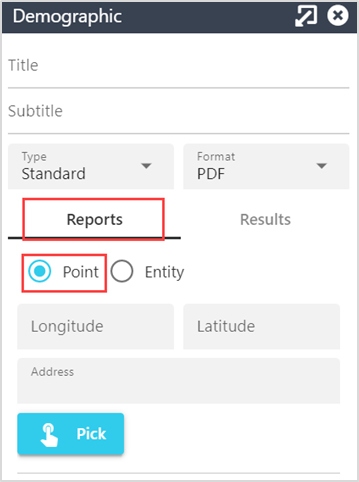
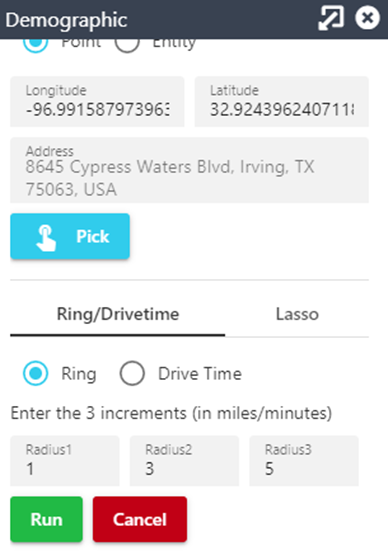
Enter Title and Subtitle in the respective fields. Choose a template and format in the respective drop-downs. Click Pick in the report window and pick a point on the map. Coordinates display. Alternatively enter the coordinates of the location whose demographic report is required. Choose Drive Time or Ring. Choose the radii in the textboxes provided to change the trade area size.
|
Click Run.
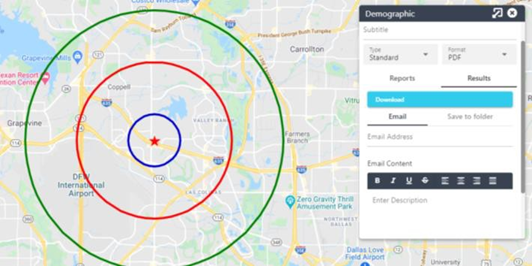
Click Download to access the report.
Click Cancel to close Reports window.
Pick an Entity
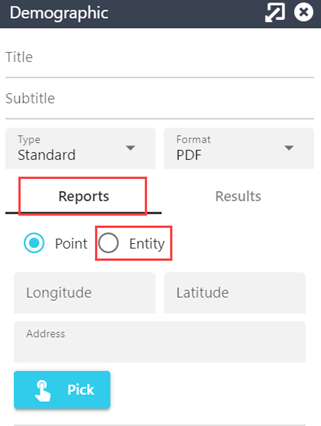
a. Select the radio button Entity on the Reports tab.
|
|
|
|
|
|
|
Enter Title and Subtitle in the respective fields. Choose a template and the format in the respective drop-downs. Select a type from the Entity Type drop down.
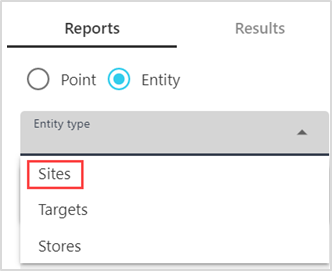
Click Pick and select an entity from the map.
|
|---|
|
|
|
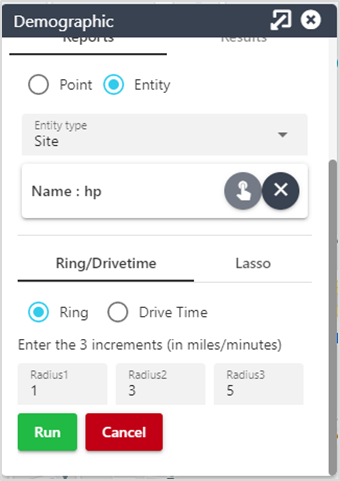
The map view will zoom into the entity and Entity Name will be automatically populated in Reports Window.
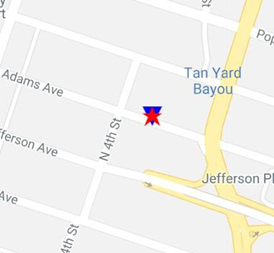
Choose a trade area in the Report Type drop-down. Change the radii to change the trade area size, as applicable. Click Run.
A download button displays.
Click Download to generate the report.
|
|
The download will display.
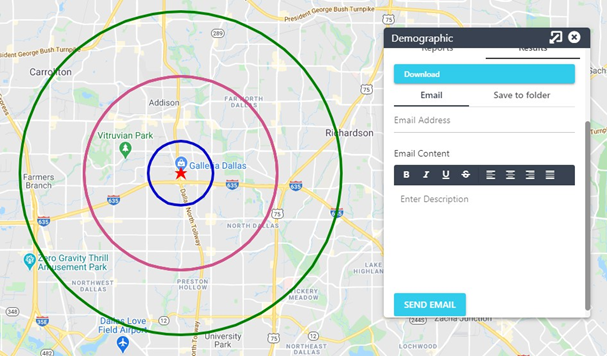
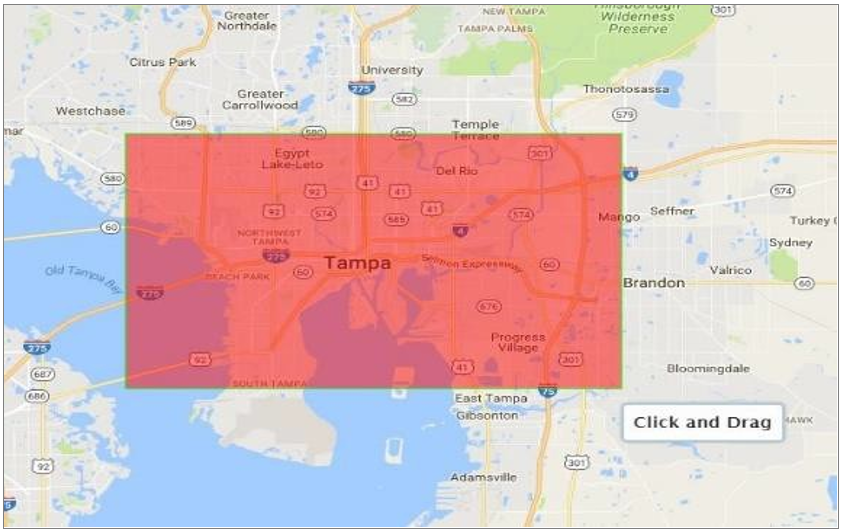
Pick Lasso Tool
Select Lasso tab on the Reports Window.
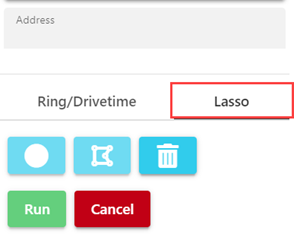
Choose a shape.
Click on the map and drag over the desired area to generate shape.
Click Run.
Click Download to access the report.
Step
|
Action |
|
|
|
f. Click Cancel to close Reports window.
|
|
|
PRINT MAP
Step
|
Action
|
| 1. |
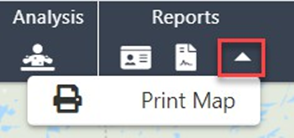
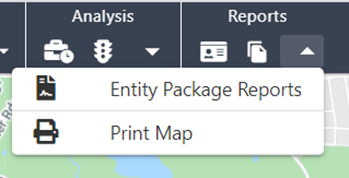
Click Print Map.
|
| 2. |
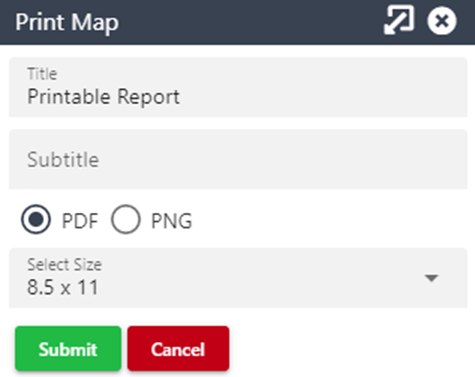
- Enter the title and subtitle.
- Click the radio button PDF or PNG, as applicable.
- Choose a size in the Select Size drop-down.
-
Click Submit.
|
3.
|
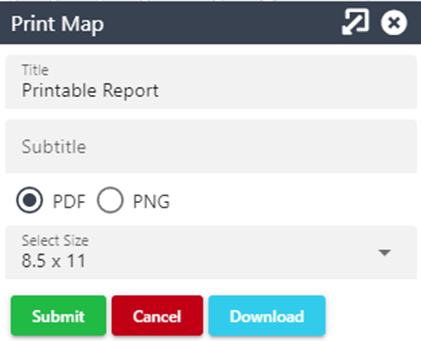
Click Download.
|
4.
|
Click Cancel to close the Print Map tool.
|
ENTITY PACKAGE REPORT - SITE APPROVAL REPORT
Step
|
Action |
1.
|
Click Entity Package Reports in the Reports ribbon.
|
2.
|
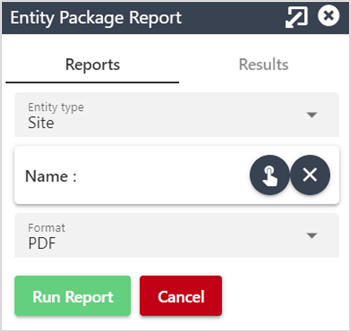
Choose a site in the Entity type drop-down.
The site name displays in Name field.
|
3.
|
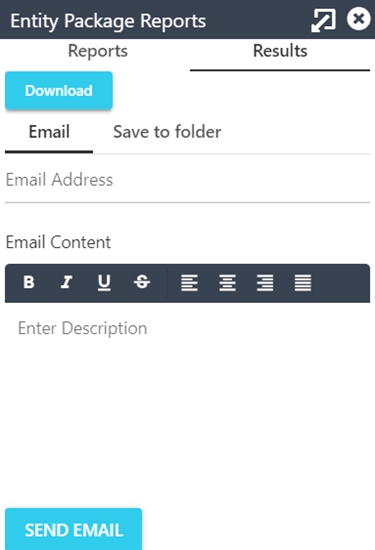
Click Run Report.
Choose one of the following:
- Download the report.
- Save to local drive.
- Email to recipient.
Note: Email files must be 10 MB or smaller
|